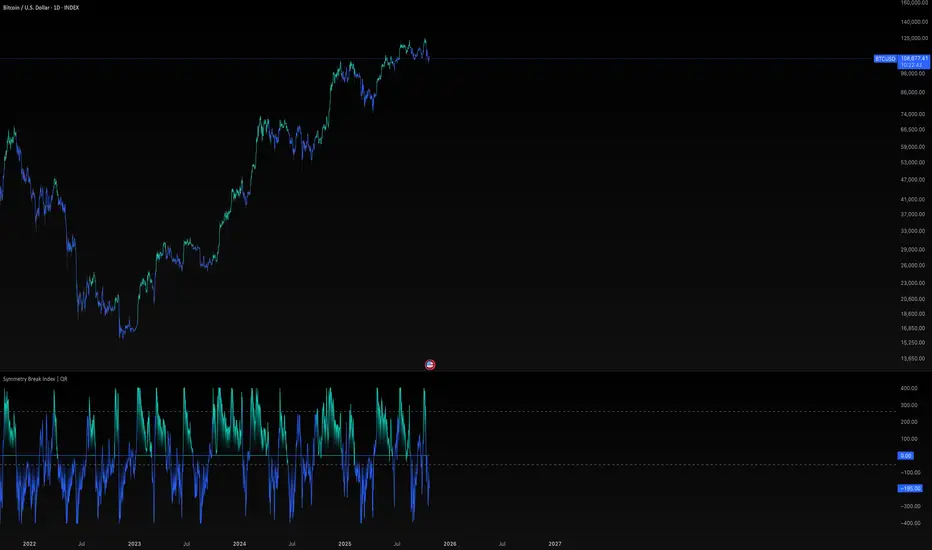
Symmetry Break Index | QR
What it does
This indicator detects trend regime shifts by measuring how persistently price deviates from its moving-average “symmetry.” It outputs a continuous Score and a binary Signal (Bullish / Bearish) when that score crosses user-defined thresholds:
Bullish (Long) when upside deviations dominate → sustained uptrend bias
Bearish (Short/Cash) when downside deviations dominate → sustained downtrend bias
It’s built for clarity and consistency: the plot is a single score with two horizontal decision lines so traders can quickly identify regime changes on a clean chart.
How it works (principle, not code)
Normalize price vs trend: Price is standardized against a moving average and its standard deviation to create a dimensionless “oscillator” series (how far above/below typical behavior price sits).
Symmetry count: For a user-defined range of reference levels, the script counts whether the standardized price is above or below each level. This builds a cumulative symmetry score: positive when upside presence is broad and persistent, negative when downside dominates.
Regime thresholds: Crossing the Uptrend Threshold or Downtrend Threshold flips the quantum state to Bullish or Bearish, minimizing noise compared with a single-level trigger.
This approach emphasizes persistence and breadth of deviation rather than one-off spikes, which can help filter chop.
Plots & visuals
Score (histogram/area fill): Positive area fills in the bullish color, negative area in the bearish color.
Zero line: Quick reference for balance between up/down deviations.
Two decision lines: Uptrend Threshold and Downtrend Threshold to mark regime flips.
Bar colors: Bars tint with the active regime (Bullish / Bearish) for fast reads.
Publish with a clean chart so the score and thresholds are clearly visible. Avoid extra indicators unless they are required and explained.
Inputs & customization
MA Length (default 40): Window for the baseline moving average and volatility. Shorter = more reactive; longer = smoother.
Source: Price input (e.g., close).
For Loop Range (Start / End, default −200…200): Breadth of reference levels in the symmetry count. Wider range = stronger smoothing and slower flips.
Uptrend / Downtrend Thresholds: Regime triggers. Tighten to react faster, widen to reduce whipsaws.
Color Mode: Choose a palette to match your chart.
Tip: Start with defaults, then tune MA Length and thresholds for your market/timeframe.
How to use it
Trend confirmation: Trade in the direction of the active regime; avoid counter-trend setups when the score is far beyond a threshold.
Risk controls: When the score retreats toward zero, consider reducing size or tightening stops—momentum is weakening.
Confluence: Combine with structure (S/R), volume, or volatility bands for entries/exits; the score provides context, not entries alone.
Originality & value
Unlike single-threshold oscillators, this method aggregates many standardized comparisons into one score, rewarding persistence and breadth of deviation. The result is a robust regime signal that tends to filter fleeting wiggles and highlight true symmetry breaks.
Limitations
Extremely range-bound markets can still produce false flips if thresholds are too tight.
Sudden volatility regime changes may require re-tuning MA Length or thresholds.
Standardization depends on the chosen window; there is no “one size fits all.”
Disclaimer
This tool is for research/education and is not financial advice. Markets involve risk, including loss of capital. Past performance does not predict or guarantee future results. Always test settings on your timeframe and use prudent risk management.
Skript nur auf Einladung
Ausschließlich Nutzer mit einer Erlaubnis des Autors können Zugriff auf dieses Script erhalten. Sie müssen diese Genehmigung bei dem Autor beantragen. Dies umfasst üblicherweise auch eine Zahlung. Wenn Sie mehr erfahren möchten, dann sehen Sie sich unten die Anweisungen des Autors an oder kontaktieren Sie QuantumResearch direkt.
TradingView empfiehlt NICHT, für die Nutzung eines Scripts zu bezahlen, wenn Sie den Autor nicht als vertrauenswürdig halten und verstehen, wie das Script funktioniert. Sie können außerdem auch kostenlose Open-Source-Alternativen in unseren Community-Scripts finden.
Hinweise des Autors
whop.com/quantum-whop/
⚒️ Get access to our toolbox here for free:
quantumresearchportfolio.carrd.co
All tools and content provided are for informational and educational purposes only.
Haftungsausschluss
Skript nur auf Einladung
Ausschließlich Nutzer mit einer Erlaubnis des Autors können Zugriff auf dieses Script erhalten. Sie müssen diese Genehmigung bei dem Autor beantragen. Dies umfasst üblicherweise auch eine Zahlung. Wenn Sie mehr erfahren möchten, dann sehen Sie sich unten die Anweisungen des Autors an oder kontaktieren Sie QuantumResearch direkt.
TradingView empfiehlt NICHT, für die Nutzung eines Scripts zu bezahlen, wenn Sie den Autor nicht als vertrauenswürdig halten und verstehen, wie das Script funktioniert. Sie können außerdem auch kostenlose Open-Source-Alternativen in unseren Community-Scripts finden.
Hinweise des Autors
whop.com/quantum-whop/
⚒️ Get access to our toolbox here for free:
quantumresearchportfolio.carrd.co
All tools and content provided are for informational and educational purposes only.