PROTECTED SOURCE SCRIPT
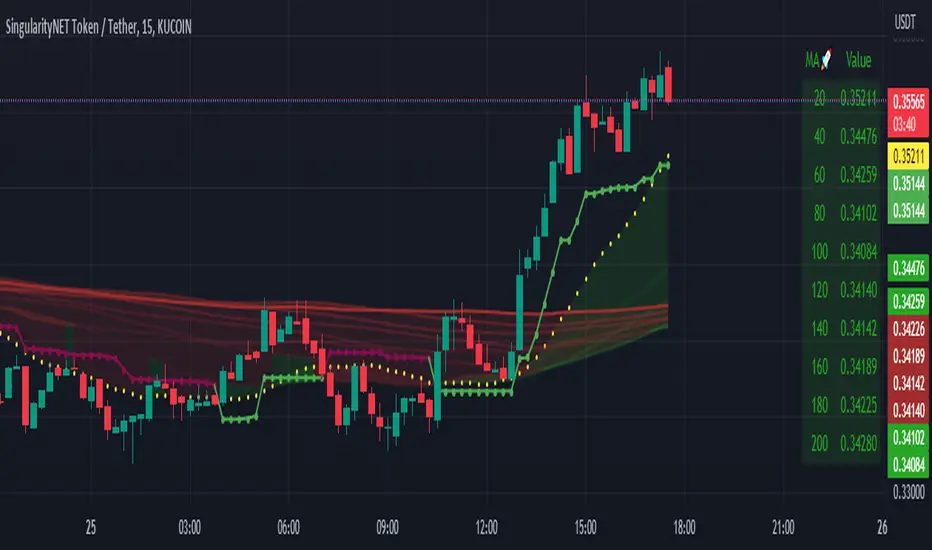
Aktualisiert Moving Average Scalper by nnamdert

What does this Indicator Do?
By request and popular demand, I have created a quick and easy Moving Average Crossover Scalper Indicator. This indicator simply allows the trader to visualize scalping opportunities in an easy way using MA crossovers.
The Indicator also plots multiple higher moving averages via an "optional" table. The table gives a quick glance at the overall trend (based on moving Averages alone).
Users can adjust the initial Moving Average Length and the number of additional Moving Average Lengths to be plotted on the chart.
How do I use it?
As shown below, the cross overs are very easy to see. The Stoploss "should" be set at the most recent swing high or low prior to the MA Cross.
The dotted yellow line must cross above or below the thick mutli-colored line in order to be considered valid.
https://www.tradingview.com/x/J3ZEzxAT/
As seen in the screenshot below, an optional input setting turns ON / OFF additional Moving Average "Lines" and plots them on the chart. In addition, the indicator color fills between the moving averages based on Bullish or Bearish movement. If the lines are in continuity, then the color will be either RED or GREEN depending on the market sentiment (bull or bear).
https://www.tradingview.com/x/xV0FEJU0/
The total number of Moving Averages listed in the table can be manually adjusted in the settings by the user. The table is small and see-through so it works on mobile devices as well and allows the user to still see the candles easily. Simply double clicking on the table will bring up the settings.
https://www.tradingview.com/x/s4yUalUE/
As shown below, the table can be relocated to a position acceptable to the user if it is in the way. This option is available under input settings.
https://www.tradingview.com/x/cRpKbegW/
I hope this indicator proves useful for you and your trading style. If you have any suggestions please let me know.
Versionshinweise
1. Added Pivot Point Labels to help guide traders to Stoploss and Take Profit areas2. Added Chandelier Exit for additional Stoploss and entry confrimation
3. Added additional input customizations
Fixed a few minor bugs in the color coded Moving Average fan
Code Cleanup to make the Indicator run smoother
Versionshinweise
Added Alerts to the script so you don't have to watch it all day. It still works best in conjunction with our FMP TF Indicator. It is important that they are used together for best results.https://www.tradingview.com/script/ZAWzY55K-FOREX-Master-Pattern-Trend-Finder-by-nnamdert/
Turned ON the Chandelier Exit by default as it is pretty much required in order to use the indicator correctly.
Turned ON the Average Fan by default as it is pretty helpful (you can always turn it off under inputs).
Added the ability t change the base moving average color (yellow dots) to meet your requirements.
Versionshinweise
Added VWAP to the IndicatorVersionshinweise
Adjusted defaults to clean up the indicator. Some features must be turned ON by the user now and are OFF by default.Geschütztes Skript
Dieses Script ist als Closed-Source veröffentlicht. Sie können es kostenlos und ohne Einschränkungen verwenden – erfahren Sie hier mehr.
Join our DISCORD for more free private indicators or if you need TRAINING on our Indicators.
discord.com/invite/nZfY854MXR
Become a Patron
patreon.com/nnamdert
discord.com/invite/nZfY854MXR
Become a Patron
patreon.com/nnamdert
Haftungsausschluss
Die Informationen und Veröffentlichungen sind nicht als Finanz-, Anlage-, Handels- oder andere Arten von Ratschlägen oder Empfehlungen gedacht, die von TradingView bereitgestellt oder gebilligt werden, und stellen diese nicht dar. Lesen Sie mehr in den Nutzungsbedingungen.
Geschütztes Skript
Dieses Script ist als Closed-Source veröffentlicht. Sie können es kostenlos und ohne Einschränkungen verwenden – erfahren Sie hier mehr.
Join our DISCORD for more free private indicators or if you need TRAINING on our Indicators.
discord.com/invite/nZfY854MXR
Become a Patron
patreon.com/nnamdert
discord.com/invite/nZfY854MXR
Become a Patron
patreon.com/nnamdert
Haftungsausschluss
Die Informationen und Veröffentlichungen sind nicht als Finanz-, Anlage-, Handels- oder andere Arten von Ratschlägen oder Empfehlungen gedacht, die von TradingView bereitgestellt oder gebilligt werden, und stellen diese nicht dar. Lesen Sie mehr in den Nutzungsbedingungen.