OPEN-SOURCE SCRIPT
Aktualisiert [blackcat] L1 Larry Williams VixFix Indicator
Level : L1
Larry Williams, had this idea to create a synthetic VIX for more than just the main stock indices. Check out the formula for Williams VixFix:
```
VIX Fix Formula = (Highest(Close, 22) – Low) / (Highest(Close, 22)) * 100
```
What does this even mean? In normal person terms, here's what it's all about:
1. Find the highest close over the last 22 days and subtract today's low (or the current bar).
2. Divide that by the highest close of the past 22 days.
3. Multiply the result by 100 to "normalize" the indicator.
Why 22 days, you ask? That's how long the normal month of trading days is.
So, you see, the formula is pretty chill. It's just a way to measure the price volatility of the last 22 trading days. It's a bit of a lagging indicator, but it gets the job done.
Here my version of this scriptcreates a custom technical indicator called "L1 Larry Williams VixFix" that measures the distance between the highest high and the lowest low of a security's price over a specified period.
The user can adjust the period length and source price used in the VixFix calculation. The period length is set to 22 by default, but can be modified by the user with the "Length" input parameter. The source price is set to "close" by default, meaning it will use the closing price of each bar to calculate the VixFix. However, the user can also choose a different type of price data, such as open, high, or low.
The VixFix is calculated as a percentage of the difference between the highest close and the lowest low over the specified period. This percentage is then multiplied by 100 to create a more readable value.
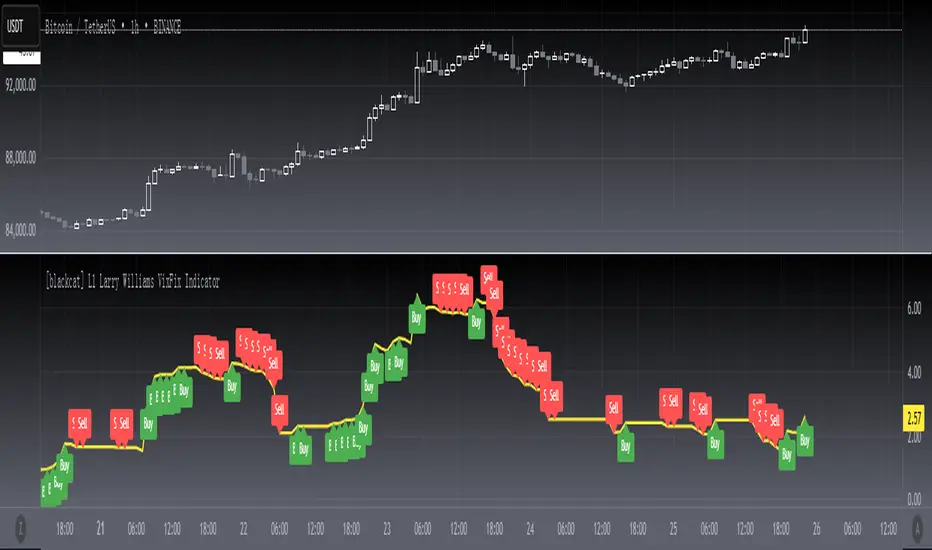
Finally, the code plots the VixFix line on the chart with a yellow color and a thickness of 2. This allows the user to easily visualize the VixFix value and incorporate it into their trading decisions.
Overall, this script provides a powerful tool for technical analysis that can help traders identify potential trend changes and market reversals.
Larry Williams, had this idea to create a synthetic VIX for more than just the main stock indices. Check out the formula for Williams VixFix:
```
VIX Fix Formula = (Highest(Close, 22) – Low) / (Highest(Close, 22)) * 100
```
What does this even mean? In normal person terms, here's what it's all about:
1. Find the highest close over the last 22 days and subtract today's low (or the current bar).
2. Divide that by the highest close of the past 22 days.
3. Multiply the result by 100 to "normalize" the indicator.
Why 22 days, you ask? That's how long the normal month of trading days is.
So, you see, the formula is pretty chill. It's just a way to measure the price volatility of the last 22 trading days. It's a bit of a lagging indicator, but it gets the job done.
Here my version of this scriptcreates a custom technical indicator called "L1 Larry Williams VixFix" that measures the distance between the highest high and the lowest low of a security's price over a specified period.
The user can adjust the period length and source price used in the VixFix calculation. The period length is set to 22 by default, but can be modified by the user with the "Length" input parameter. The source price is set to "close" by default, meaning it will use the closing price of each bar to calculate the VixFix. However, the user can also choose a different type of price data, such as open, high, or low.
The VixFix is calculated as a percentage of the difference between the highest close and the lowest low over the specified period. This percentage is then multiplied by 100 to create a more readable value.
Finally, the code plots the VixFix line on the chart with a yellow color and a thickness of 2. This allows the user to easily visualize the VixFix value and incorporate it into their trading decisions.
Overall, this script provides a powerful tool for technical analysis that can help traders identify potential trend changes and market reversals.
Versionshinweise
upgrade to v5Versionshinweise
upgrade to v5Versionshinweise
OVERVIEWThe [blackcat] L1 Larry Williams VixFix Indicator is designed to help traders gauge market volatility and identify potential buy and sell opportunities. Based on the original concept by Larry Williams, this indicator calculates the VixFix value, which reflects the range between the highest close and the lowest low over a specified period. By plotting this value and generating corresponding labels, traders can make informed decisions about market entry and exit points 📊💹.
FEATURES
Calculates the VixFix value based on the highest close and lowest low within a given length:
Length: User-defined period for calculating extremes.
Source: Price source for calculation (default: Close).
Plots the VixFix value on a separate pane for easy visualization 📈
Displays buy ('Buy') and sell ('Sell') labels on the chart for quick identification 🏷️
Generates alerts when buy or sell conditions are met 🔔
HOW TO USE
Add the indicator to your TradingView chart by selecting it from the indicators list.
Adjust the Length parameter to suit your preferred sensitivity.
Monitor the chart for buy and sell labels indicating potential trade opportunities.
Set up alerts based on the generated signals to receive notifications when conditions are met 📲.
Combine this indicator with other tools for confirmation before making trading decisions.
LIMITATIONS
The indicator relies solely on price ranges, which might not capture all market nuances.
False signals can occur in ranging or sideways markets 🌪️.
Users should always confirm signals with other forms of analysis.
NOTES
Ensure that you have sufficient historical data available for accurate calculations.
Test the indicator thoroughly on demo accounts before applying it to live trading 🔍.
Customize the appearance and parameters as needed to fit your trading strategy.
Open-source Skript
Ganz im Sinne von TradingView hat dieser Autor sein/ihr Script als Open-Source veröffentlicht. Auf diese Weise können nun auch andere Trader das Script rezensieren und die Funktionalität überprüfen. Vielen Dank an den Autor! Sie können das Script kostenlos verwenden, aber eine Wiederveröffentlichung des Codes unterliegt unseren Hausregeln.
Avoid losing contact!Don't miss out! The first and most important thing to do is to join my Discord chat now! Click here to start your adventure: discord.com/invite/ZTGpQJq 防止失联,请立即行动,加入本猫聊天群: discord.com/invite/ZTGpQJq
Haftungsausschluss
Die Informationen und Veröffentlichungen sind nicht als Finanz-, Anlage-, Handels- oder andere Arten von Ratschlägen oder Empfehlungen gedacht, die von TradingView bereitgestellt oder gebilligt werden, und stellen diese nicht dar. Lesen Sie mehr in den Nutzungsbedingungen.