OPEN-SOURCE SCRIPT
Aktualisiert Bull Bear Power With EMA Filter
Description of Indicator:
This Pine Script indicator colors price bars based on the open price in relation to custom moving averages (EMA/SMA), Bull/Bear Power (BBPower), and an optional VWAP filter. The bar colors help identify bullish and bearish conditions with added visual cues for price positioning relative to VWAP.
Key Features:
Customizable Moving Averages (EMA/SMA):
The user can select between EMA or SMA for both short-term and long-term moving averages.
Default moving averages are set to 5 (short-term) and 9 (long-term) but can be adjusted by the user.
Bullish Condition (Blue or Purple Bars):
A bar is colored blue if the following conditions are met:
The open price is above both the short-term and long-term moving averages.
The short-term moving average (MA 1) is above the long-term moving average (MA 2).
BBPower (open price minus the 13-period EMA) is positive, indicating bullish strength.
If the VWAP filter is enabled and the price opens below VWAP, the bullish bars will turn purple.
Bearish Condition (Yellow or Orange Bars):
A bar is colored yellow if the following conditions are met:
The open price is below both the short-term and long-term moving averages.
The short-term moving average (MA 1) is below the long-term moving average (MA 2).
BBPower is negative or zero, indicating bearish market conditions.
If the VWAP filter is enabled and the price opens above VWAP, the bearish bars will turn orange.
VWAP Filter (Optional):
An optional filter allows the user to add VWAP (Volume-Weighted Average Price) to the bar coloring logic.
When the VWAP filter is enabled, it provides additional information about price positioning relative to VWAP, turning bullish bars purple and bearish bars orange depending on whether the price opens above or below VWAP.
Usage:
Bullish Trend: Look for blue or purple bars to identify potential bullish momentum.
Bearish Trend: Look for yellow or orange bars to spot bearish conditions in the market.
The indicator allows users to customize the length and type of moving averages (EMA or SMA), as well as decide whether to apply the VWAP filter.
This indicator provides traders with clear visual signals to quickly assess the strength of bullish or bearish conditions based on the price's position relative to custom moving averages, BBPower, and VWAP, helping with trend identification and potential trade setups.
Versionshinweise
Bull Bear Power With Adjustable Thresholds and LengthThis indicator calculates Bull Bear Power (BBP) with two customizable thresholds and a configurable length for more flexibility in identifying bullish and bearish market conditions. It also applies an EMA filter and optionally a VWAP filter to refine signals.
Features:
Adjustable BBP Length:
The length of the BBP calculation can be set by the user, defaulting to a 5-period EMA. This makes the indicator adaptable to different market conditions and timeframes.
Separate Bullish and Bearish Thresholds:
Users can set individual thresholds for bullish and bearish signals, allowing more control over the sensitivity of each condition.
MA Filters:
Two moving averages (MA1 and MA2) can be selected using either Exponential Moving Average (EMA) or Simple Moving Average (SMA), with adjustable lengths. These MAs are used to filter out noise and help confirm market trends.
VWAP Filter:
An optional Volume-Weighted Average Price (VWAP) filter is available to refine bullish and bearish conditions further. This feature helps assess whether the price is trading above or below VWAP, influencing how the bars are colored.
Visual Representation:
The indicator colors the bars based on bullish or bearish conditions:
Bullish bars are colored blue, with the option to turn purple if below VWAP.
Bearish bars are colored yellow, turning orange if above VWAP.
Moving Average and VWAP Plots:
The selected moving averages and VWAP are plotted on the chart for visual reference, helping traders spot trends and support/resistance levels.
Usage:
Use this indicator to detect bullish and bearish market conditions based on user-defined BBP thresholds and moving average trends.
The VWAP filter adds another layer of precision by assessing the price relative to the average market volume.
This script is ideal for traders looking to customize their market analysis tools for more precise and adaptive strategies.
Versionshinweise
Bull Bear Power With EMA FilterThis indicator calculates Bull Bear Power (BBP) to help identify bullish and bearish market conditions, using an Exponential Moving Average (EMA) filter. It also includes an optional Volume-Weighted Average Price (VWAP) filter for enhanced precision in detecting trends.
Features:
Adjustable BBP Length:
The length of the Bull Bear Power calculation can be adjusted by the user, with a default setting of 5 periods. This makes the indicator adaptable to different timeframes and trading strategies.
Fixed BBP Threshold:
Bullish signals are generated when BBP is greater than 0, and bearish signals are generated when BBP is less than or equal to 0. The simplicity of this approach makes it easy to interpret market direction.
Moving Average Filters:
Two moving averages (MA1 and MA2) can be customized using either EMA or Simple Moving Average (SMA), with adjustable lengths. These moving averages help confirm bullish and bearish trends.
VWAP Filter:
An optional VWAP filter is available to refine bullish and bearish conditions further. When activated, the indicator checks whether the price is above or below VWAP, and adjusts the color of the bars accordingly.
Visual Representation:
Bullish bars are colored blue when above both moving averages and BBP is positive. If the price is below VWAP, these bars are colored purple for additional clarity.
Bearish bars are colored yellow when below both moving averages and BBP is negative or zero. If the price is above VWAP, these bars turn orange to signal potential reversals.
Moving Average and VWAP Plots:
Both selected moving averages and VWAP are plotted on the chart to provide a clear view of price trends and support/resistance levels.
Usage:
This indicator is ideal for traders who want to detect market trends based on price momentum and volume.
The customizable BBP length allows flexibility, making the indicator suitable for various timeframes, from short-term to long-term analysis.
This streamlined version of the Bull Bear Power indicator offers a user-friendly approach to identifying trends, with powerful customization options for moving averages and BBP length.
Versionshinweise
Bull Bear Power with EMA and VWAP Filter (Based on Prior Candle)This script is designed to provide a dynamic visual representation of market trends by combining Exponential Moving Averages (EMAs), VWAP (Volume Weighted Average Price), and Bull/Bear Power with custom candle coloring based on the previous candle’s EMA values. The colors indicate whether bullish or bearish conditions are met, factoring in how the current candle’s open price compares to the previous candle's EMAs.
Bullish Candles:
Green when the open price is above both the fast and slow EMAs (from the prior candle), the fast EMA is greater than the slow EMA, and the price is above the VWAP.
Blue when the open price is above both EMAs, the fast EMA is greater than the slow EMA, but the price is below the VWAP.
Bearish Candles:
Red when the open price is below both the fast and slow EMAs (from the prior candle), the fast EMA is less than the slow EMA, and the price is below the VWAP.
Orange when the open price is below both EMAs, the fast EMA is less than the slow EMA, but the price is above the VWAP.
Default Candle Coloring:
If no bullish or bearish conditions are met:
Purple when the current candle closes higher than it opens.
Yellow when the current candle closes lower than it opens.
Dynamic EMA and VWAP Plots:
The fast EMA turns green when it is above the slow EMA and red when it is below.
The slow EMA remains white for consistent reference.
VWAP is plotted for traders who choose to enable the VWAP filter.
Versionshinweise
Bull Bear Power with EMA, VWAP, and Adjustable BBP Filter (Based on Prior Candle)This indicator provides a dynamic visual representation of market trends by combining Exponential Moving Averages (EMAs), VWAP, and Bull/Bear Power with custom candle coloring. It factors in how the current candle's open price compares to the previous candle's EMA values and includes user-adjustable settings for the Bull/Bear Power (BBP) calculation.
Bullish Candles:
Green when the open price is above both the fast and slow EMAs (from the prior candle), the fast EMA is greater than the slow EMA, and Bull Power is above 0 (i.e., bullish strength).
Blue when the open price is above both EMAs, the fast EMA is greater than the slow EMA, but Bull Power is above 0 and the price is below VWAP.
Bearish Candles:
Red when the open price is below both the fast and slow EMAs (from the prior candle), the fast EMA is less than the slow EMA, and Bull Power is below 0 (i.e., bearish strength).
Orange when the open price is below both EMAs, the fast EMA is less than the slow EMA, but Bull Power is below 0 and the price is above VWAP.
Custom BBP EMA: The EMA length used for calculating Bull/Bear Power is fully adjustable by the user for flexible market analysis.
Default Candle Coloring:
If no bullish or bearish conditions are met:
Purple when the current candle closes higher than it opens.
Yellow when the current candle closes lower than it opens.
Dynamic EMA and VWAP Plots:
The fast EMA turns green when it is above the slow EMA and red when it is below.
The slow EMA remains white for consistent reference.
VWAP is plotted for traders who choose to enable the VWAP filter. (Blue when price above, yellow when price below)
Versionshinweise
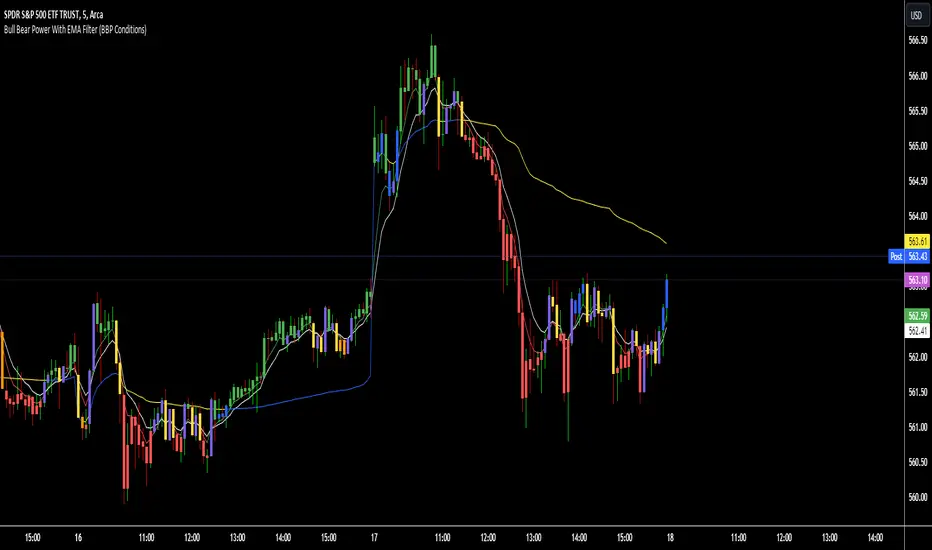
The "Bull Bear Power With EMA Filter (BBP Conditions)" indicator combines traditional Bull/Bear Power analysis with Exponential Moving Averages (EMA) and an optional Volume Weighted Average Price (VWAP) filter for enhanced trading signals. The indicator is designed to provide insights into market strength by measuring the difference between the price and the underlying EMA, while allowing users to refine this analysis with dynamic moving averages and VWAP conditions.Key Features:
Bull/Bear Power Calculation:
Bull Power: Measures the distance between the current price (close) and an EMA, showing whether bulls are strong enough to push prices above the EMA.
Bear Power: Measures the difference between the current low and an EMA, giving insight into how much strength the bears have in driving prices below the EMA.
EMA Filter:
The user can select two types of Moving Averages (EMA or SMA) with customizable lengths to compare price behavior with shorter- and longer-term trends.
Fast and slow EMAs (or SMAs) help define the trend direction and strength, which is then used in combination with Bull/Bear Power values to generate bullish or bearish conditions.
Candle Color Conditions:
Bullish and bearish conditions based on EMA alignment (fast vs. slow) are combined with Bull/Bear Power to determine the candle color.
Colors dynamically change based on the strength of bulls or bears and the relative position of the price against the chosen moving averages.
VWAP Filter (Optional):
The VWAP filter helps traders focus on the relationship between the current price and the average price traded for the day.
When enabled, the candle color is influenced by whether the price is above or below the VWAP, providing additional context for market conditions.
New Update: VWAP Filter Repair
In this version, the VWAP functionality has been repaired to give users full control over its influence on the indicator:
VWAP Functionality: The VWAP filter was previously always influencing the candle color logic, even when disabled. This has now been corrected.
When VWAP is enabled: The candle colors are influenced by whether the price is above or below the VWAP, adding an additional layer of analysis on top of the Bull/Bear Power and EMA conditions.
When VWAP is disabled: The indicator disregards all VWAP conditions and instead focuses solely on the EMA-based bullish or bearish conditions and Bull/Bear Power values.
VWAP Plotting: The VWAP line is now only plotted on the chart if the "Use VWAP filter?" option is enabled. If disabled, VWAP is not displayed, reducing chart clutter and keeping the focus on the selected moving averages and Bull/Bear Power analysis.
This update ensures that the VWAP filter behaves as expected, giving users full flexibility to toggle it on or off without unintended impact on the analysis.
Open-source Skript
Ganz im Sinne von TradingView hat dieser Autor sein/ihr Script als Open-Source veröffentlicht. Auf diese Weise können nun auch andere Trader das Script rezensieren und die Funktionalität überprüfen. Vielen Dank an den Autor! Sie können das Script kostenlos verwenden, aber eine Wiederveröffentlichung des Codes unterliegt unseren Hausregeln.
Haftungsausschluss
Die Informationen und Veröffentlichungen sind nicht als Finanz-, Anlage-, Handels- oder andere Arten von Ratschlägen oder Empfehlungen gedacht, die von TradingView bereitgestellt oder gebilligt werden, und stellen diese nicht dar. Lesen Sie mehr in den Nutzungsbedingungen.