™TradeChartist Intensity
™TradeChartist Intensity itself doesn't plot BUY or SELL signals, but when used with ™TradeChartist Rubicon gives a better picture for trade confirmations. It can also be used as a standalone indicator and works equally effective with other traditional and non-traditional indicators.
The indicator comes with simple settings with useful features outlined below.
Intensity Color Candles
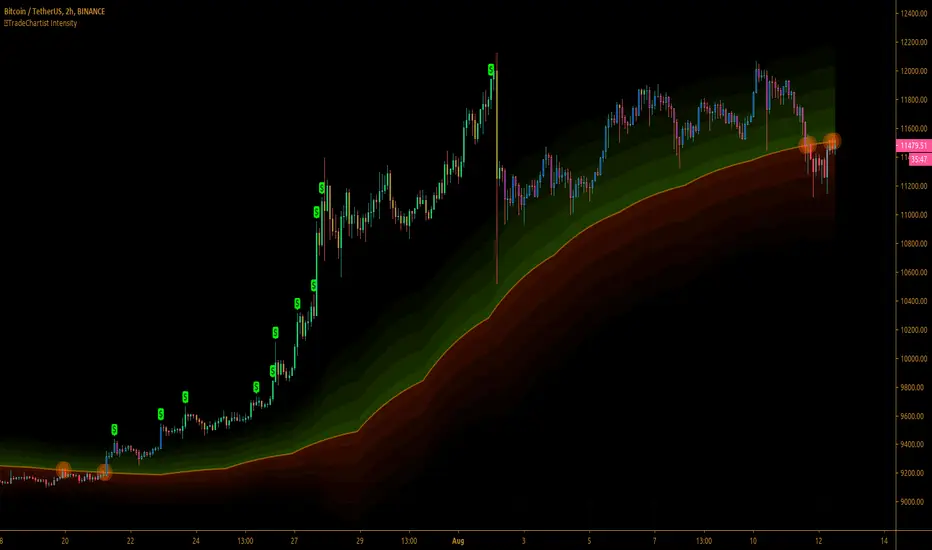
Intensity Color Candles when activated from settings paints the candles/bars with colors specific to the Bull/Bear limits or the outer space and is easy to identify the signal strength over time.
- Uptrend - The bars/candles move away from the Orange Price Equilibrium line towards the upper Bull limits with bar color fading slowly leading to outer space where the bar color turns neon green.
- Downtrend - The bars/candles move away from the Orange Price Equilibrium line towards the lower Bear limits with bar color fading slowly leading to outer space where the bar color turns neon red.
When the price candle wick or body touches the Orange Price Equilibrium line, distinct torchlight circle appears to signal the trader of a potential change in price direction which can be used as a signal confirmation in conjunction with another indicator before taking a trade position.
Show Auto Fib Levels
Auto Fib Levels plot automatic Fib levels based on significant Highs and Lows based on Intensity strategy which mostly are reference prices of recent highest high above Orange Equilibrium price line and recent lowest low below the Orange Equilibrium price line.
15m XBT chart with 'Show Auto Fib Levels' checked and 'Show Fibs from current High/Low' unchecked under indicator settings
These Auto Fib Levels change when the price movement/trend changes direction and will be based on trending price direction.
Show Fibs from current High/Low
When this option is chosen from indicator settings, the auto fib levels are drawn from the highest high of the trending price direction to lowest low of last trend for uptrend or vice-versa for downtrend.
15m XBT chart as above with 'Show Fibs from current High/Low' unchecked under indicator settings
Show Profit Candles
Activating this option from indicator settings will automatically plot $ labels above candle highs that hit important resistance levels during uptrend and candle lows that hit important support levels during downtrend. This will help traders take out profits during trades based on their personal profit goals and realistic trade targets based on momentum/RSI/volatility etc.
Example chart of XAUUSD 1hr Gold chart showing both Long and Short trade Profit candles
Give a thumbs up or leave a comment if you like the script.
Added - Option to hide/unhide Intensity Bands
Added - Highs/Lows plot for updated Auto-Fibs calculation
Removed AutoFibs as it is computation heavy and creates Memory usage limit error.
Skript nur auf Einladung
Ausschließlich Nutzer mit einer Erlaubnis des Autors können Zugriff auf dieses Script erhalten. Sie müssen diese Genehmigung bei dem Autor beantragen. Dies umfasst üblicherweise auch eine Zahlung. Wenn Sie mehr erfahren möchten, dann sehen Sie sich unten die Anweisungen des Autors an oder kontaktieren Sie TradeChartist direkt.
TradingView empfiehlt NICHT, für die Nutzung eines Scripts zu bezahlen, wenn Sie den Autor nicht als vertrauenswürdig halten und verstehen, wie das Script funktioniert. Sie können außerdem auch kostenlose Open-Source-Alternativen in unseren Community-Scripts finden.
Hinweise des Autors
Telegram - @Trade_Chartist
Free Scripts - bit.ly/Free-Scripts
Haftungsausschluss
Skript nur auf Einladung
Ausschließlich Nutzer mit einer Erlaubnis des Autors können Zugriff auf dieses Script erhalten. Sie müssen diese Genehmigung bei dem Autor beantragen. Dies umfasst üblicherweise auch eine Zahlung. Wenn Sie mehr erfahren möchten, dann sehen Sie sich unten die Anweisungen des Autors an oder kontaktieren Sie TradeChartist direkt.
TradingView empfiehlt NICHT, für die Nutzung eines Scripts zu bezahlen, wenn Sie den Autor nicht als vertrauenswürdig halten und verstehen, wie das Script funktioniert. Sie können außerdem auch kostenlose Open-Source-Alternativen in unseren Community-Scripts finden.
Hinweise des Autors
Telegram - @Trade_Chartist
Free Scripts - bit.ly/Free-Scripts