PROTECTED SOURCE SCRIPT
Liq Levels [KoTa]
Liq Levels [KoTa] User Guide
Overview
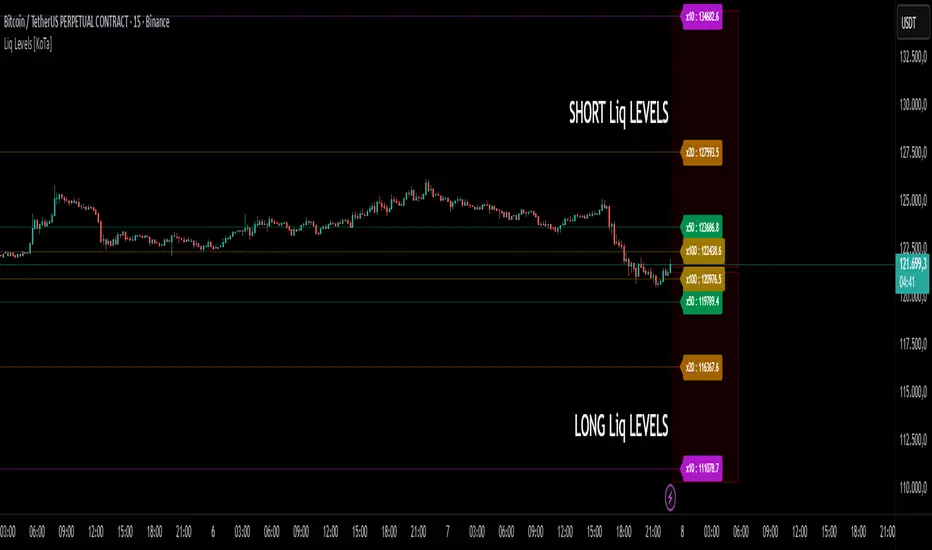
Liquidation Levels [HG] visualizes precomputed long & short liquidation price levels relative to the current market price.
For each enabled leverage level (5×, 10×, 20× …), it draws two horizontal lines and small labels:
Short liquidation line (above price) = price × short_multiplier
Long liquidation line (below price) = price × long_multiplier
You can choose which leverage levels to display, control label formatting, choose whether to use the previous bar’s close (no-repaint), change line style & extension, and toggle label size.
Inputs / Settings (what they do)
Use Previous Close (No Repaint) (useConfirmed)
true: the indicator uses close[1] (previous bar close) as reference. Prevents intrabar repainting — recommended for backtesting and stable signals.
false: uses close (current price) — updates intrabar and will repaint during the bar.
Show Price in Label (showValues)
true shows the numeric price next to the x label (e.g., 5x : 42,952.78), false shows only 5x.
Line Style (styleType) — "dot", "line", "dashed".
Extend Lines (extendType) — "none", "left", "right", "both".
Label Size (labelSize) — "normal", "small", "tiny".
Show 5x / 10x / 20x ... 200x (show_5x, etc.) — which multipliers are drawn.
Other technical details in code:
barOffset = 4: label & short segment are placed 4 bars to the right of current bar (so label appears to the right of the bar).
Numbers are formatted according to syminfo.mintick so labels display the appropriate decimal precision.
The script cleans up previously drawn lines & labels on every bar (deletes old objects, draws fresh ones) — so the chart does not accumulate stale objects.
What the lines represent (interpretation)
Each multiplier is precomputed and represents a liquidation price factor used to estimate where positions would be forcibly closed for a given leverage (based on some margin model).
Short multipliers > 1 → short liquidation prices sit above the reference price.
Long multipliers < 1 → long liquidation prices sit below the reference price.
Important: These multipliers are instrument- and margin-model-dependent. The indicator uses the hard-coded multipliers present in the script. Validate these against your exchange / contract type before relying on them for live position sizing.
Why use this indicator?
Use cases:
Risk awareness — see where concentrated liquidation levels sit relative to price; helps avoid taking positions dangerously close to likely liquidation clusters.
Liquidity / cascade detection — when price approaches a large cluster of liquidation levels, sharp moves and cascades can occur; indicator highlights such zones.
Order placement & risk management — place stops or reduce leverage when price nears your liquidation zone.
Trade context — helps decide whether to scale into or out of a trade if the current price is close to many leverage-level liquidation points.
Quick start — how to use (step-by-step)
Load the indicator on the chart.
Choose Use Previous Close = true if you want non-repainting historical levels; false if you prefer intrabar updating. (Recommended: true for backtesting and strategy creation.)
Enable the leverage levels you care about (e.g., 5×, 10×). Keep the number of enabled levels modest (3–4) to avoid clutter.
Choose line style & extension. If you want persistent lines visible across the chart, use extend = left or both. If you only want ephemeral current-level markers, use none.
Interpretation:
If price is approaching the long liquidation line (below price), it’s a sign long positions could be liquidated if price drops further. Consider tightening stops or reducing leverage for long exposure.
If price is approaching the short liquidation line (above price), short positions risk forced closure; similar risk management applies for shorts.
Example strategy (practical, step-by-step)
This is a risk-aware trend-following example that uses the indicator to avoid entering trades too close to liquidation clusters.
Rules
Timeframe: 15-minute or higher for clarity.
Confirm trend with a 50 EMA:
trendUp = price > EMA50
trendDown = price < EMA50
Entry (Long):
trendUp is true.
Price breaks above a short-term resistance or candle close above EMA20 (confirmation).
Distance requirement: current price must be at least X% (example 3%) above the nearest long liquidation line (i.e., price / nearest_long_liquidation >= 1.03).
Enter with defined stop loss: set SL below the nearest long liquidation line OR at a separate level (whichever is more conservative).
Position sizing: choose leverage & size so distance to liquidation gives you at least Y% equity buffer (e.g., 3–5%).
Exit / Take Profit: use risk/reward rule (e.g., 1:2 R:R), or trail stop using EMA or ATR.
Concrete numeric example (worked):
Suppose Use Previous Close = true and the indicator calculates 5× long liquidation at 95.618967 and 5× short at 110.668360 (example base price = 100).
Computation (for clarity):
5× short: 1.10668360333397 × 100 = 110.668360333397 → label shows ~110.668360
20× long: 0.956189674354271 × 100 = 95.61896743542711 → ~95.618967
Entry rule: if price crosses above EMA20 and price / nearest_long_liquidation >= 1.03 (i.e., price ≥ 95.618967 × 1.03 = 98.487536), then entry allowed. If price = 101, condition satisfied (101 / 95.618967 ≈ 1.056).
Why this helps: only enter when you have a buffer above your potential liquidation line; avoid entering directly on top of people’s liquidation levels.
Advantages
Immediate visual risk map — quickly see where liquidations are concentrated (both long & short).
Configurable & non-repainting option — Use Previous Close reduces intrabar repainting for robust backtesting.
Compact & readable — tiny labels and optional price display minimize chart clutter.
Performance-friendly — script deletes and recreates objects each bar, keeping object counts stable and within limits.
Precision formatting via syminfo.mintick so label decimals match the instrument.
Disadvantages & risks / limitations
Multipliers are fixed in the script — they may not reflect the exact margin/liquidation formula of every exchange / contract. Verify with exchange docs before relying on them for trade sizing.
Repainting risk if Use Previous Close = false (intrabar updates). For backtests and alerts you should set it true.
Not a predictor — liquidation levels are potential pressure zones, not guarantees of price movement. Many other market factors affect price action.
Instrument-specific differences — inverse perpetuals, cross margin vs isolated margin, funding rates and insurance funds may change actual liquidation mechanics — the multipliers may be inaccurate for those.
Chart object limits — TradingView has object limits. Although your script deletes and recreates objects each bar and uses max_* _count, using too many levels + large extend combinations on very low timeframes could impact platform performance.
No automatic per-position calculation — the indicator shows levels relative to current price, not your entry; if you need per-trade liquidation price, you must compute using your entry price and actual margin/leverage settings.
Visualizes common long/short liquidation price levels for several leverage multiples. Use the “Use Previous Close” option for stable, non-repainting levels. Verify multipliers vs your exchange before trading.
Long description to paste (publish page content): include the “Why use”, “How to use”, and “Strategy example” sections above plus a short disclaimer (see below).
Include a safety/legal disclaimer in the description:
This indicator is educational and does not constitute financial advice. Multipliers are precomputed and may not precisely match the liquidation mechanics of every exchange or contract. Backtest and verify on your instruments before trading live.
Final notes & suggestions for improvement
If you want tighter integration with your position data (entry price, leverage, margin type), I can add per-trade liquidation calculation inputs (entry price, leverage, maintenance margin) and draw that liquidation line relative to the instrument.
Overview
Liquidation Levels [HG] visualizes precomputed long & short liquidation price levels relative to the current market price.
For each enabled leverage level (5×, 10×, 20× …), it draws two horizontal lines and small labels:
Short liquidation line (above price) = price × short_multiplier
Long liquidation line (below price) = price × long_multiplier
You can choose which leverage levels to display, control label formatting, choose whether to use the previous bar’s close (no-repaint), change line style & extension, and toggle label size.
Inputs / Settings (what they do)
Use Previous Close (No Repaint) (useConfirmed)
true: the indicator uses close[1] (previous bar close) as reference. Prevents intrabar repainting — recommended for backtesting and stable signals.
false: uses close (current price) — updates intrabar and will repaint during the bar.
Show Price in Label (showValues)
true shows the numeric price next to the x label (e.g., 5x : 42,952.78), false shows only 5x.
Line Style (styleType) — "dot", "line", "dashed".
Extend Lines (extendType) — "none", "left", "right", "both".
Label Size (labelSize) — "normal", "small", "tiny".
Show 5x / 10x / 20x ... 200x (show_5x, etc.) — which multipliers are drawn.
Other technical details in code:
barOffset = 4: label & short segment are placed 4 bars to the right of current bar (so label appears to the right of the bar).
Numbers are formatted according to syminfo.mintick so labels display the appropriate decimal precision.
The script cleans up previously drawn lines & labels on every bar (deletes old objects, draws fresh ones) — so the chart does not accumulate stale objects.
What the lines represent (interpretation)
Each multiplier is precomputed and represents a liquidation price factor used to estimate where positions would be forcibly closed for a given leverage (based on some margin model).
Short multipliers > 1 → short liquidation prices sit above the reference price.
Long multipliers < 1 → long liquidation prices sit below the reference price.
Important: These multipliers are instrument- and margin-model-dependent. The indicator uses the hard-coded multipliers present in the script. Validate these against your exchange / contract type before relying on them for live position sizing.
Why use this indicator?
Use cases:
Risk awareness — see where concentrated liquidation levels sit relative to price; helps avoid taking positions dangerously close to likely liquidation clusters.
Liquidity / cascade detection — when price approaches a large cluster of liquidation levels, sharp moves and cascades can occur; indicator highlights such zones.
Order placement & risk management — place stops or reduce leverage when price nears your liquidation zone.
Trade context — helps decide whether to scale into or out of a trade if the current price is close to many leverage-level liquidation points.
Quick start — how to use (step-by-step)
Load the indicator on the chart.
Choose Use Previous Close = true if you want non-repainting historical levels; false if you prefer intrabar updating. (Recommended: true for backtesting and strategy creation.)
Enable the leverage levels you care about (e.g., 5×, 10×). Keep the number of enabled levels modest (3–4) to avoid clutter.
Choose line style & extension. If you want persistent lines visible across the chart, use extend = left or both. If you only want ephemeral current-level markers, use none.
Interpretation:
If price is approaching the long liquidation line (below price), it’s a sign long positions could be liquidated if price drops further. Consider tightening stops or reducing leverage for long exposure.
If price is approaching the short liquidation line (above price), short positions risk forced closure; similar risk management applies for shorts.
Example strategy (practical, step-by-step)
This is a risk-aware trend-following example that uses the indicator to avoid entering trades too close to liquidation clusters.
Rules
Timeframe: 15-minute or higher for clarity.
Confirm trend with a 50 EMA:
trendUp = price > EMA50
trendDown = price < EMA50
Entry (Long):
trendUp is true.
Price breaks above a short-term resistance or candle close above EMA20 (confirmation).
Distance requirement: current price must be at least X% (example 3%) above the nearest long liquidation line (i.e., price / nearest_long_liquidation >= 1.03).
Enter with defined stop loss: set SL below the nearest long liquidation line OR at a separate level (whichever is more conservative).
Position sizing: choose leverage & size so distance to liquidation gives you at least Y% equity buffer (e.g., 3–5%).
Exit / Take Profit: use risk/reward rule (e.g., 1:2 R:R), or trail stop using EMA or ATR.
Concrete numeric example (worked):
Suppose Use Previous Close = true and the indicator calculates 5× long liquidation at 95.618967 and 5× short at 110.668360 (example base price = 100).
Computation (for clarity):
5× short: 1.10668360333397 × 100 = 110.668360333397 → label shows ~110.668360
20× long: 0.956189674354271 × 100 = 95.61896743542711 → ~95.618967
Entry rule: if price crosses above EMA20 and price / nearest_long_liquidation >= 1.03 (i.e., price ≥ 95.618967 × 1.03 = 98.487536), then entry allowed. If price = 101, condition satisfied (101 / 95.618967 ≈ 1.056).
Why this helps: only enter when you have a buffer above your potential liquidation line; avoid entering directly on top of people’s liquidation levels.
Advantages
Immediate visual risk map — quickly see where liquidations are concentrated (both long & short).
Configurable & non-repainting option — Use Previous Close reduces intrabar repainting for robust backtesting.
Compact & readable — tiny labels and optional price display minimize chart clutter.
Performance-friendly — script deletes and recreates objects each bar, keeping object counts stable and within limits.
Precision formatting via syminfo.mintick so label decimals match the instrument.
Disadvantages & risks / limitations
Multipliers are fixed in the script — they may not reflect the exact margin/liquidation formula of every exchange / contract. Verify with exchange docs before relying on them for trade sizing.
Repainting risk if Use Previous Close = false (intrabar updates). For backtests and alerts you should set it true.
Not a predictor — liquidation levels are potential pressure zones, not guarantees of price movement. Many other market factors affect price action.
Instrument-specific differences — inverse perpetuals, cross margin vs isolated margin, funding rates and insurance funds may change actual liquidation mechanics — the multipliers may be inaccurate for those.
Chart object limits — TradingView has object limits. Although your script deletes and recreates objects each bar and uses max_* _count, using too many levels + large extend combinations on very low timeframes could impact platform performance.
No automatic per-position calculation — the indicator shows levels relative to current price, not your entry; if you need per-trade liquidation price, you must compute using your entry price and actual margin/leverage settings.
Visualizes common long/short liquidation price levels for several leverage multiples. Use the “Use Previous Close” option for stable, non-repainting levels. Verify multipliers vs your exchange before trading.
Long description to paste (publish page content): include the “Why use”, “How to use”, and “Strategy example” sections above plus a short disclaimer (see below).
Include a safety/legal disclaimer in the description:
This indicator is educational and does not constitute financial advice. Multipliers are precomputed and may not precisely match the liquidation mechanics of every exchange or contract. Backtest and verify on your instruments before trading live.
Final notes & suggestions for improvement
If you want tighter integration with your position data (entry price, leverage, margin type), I can add per-trade liquidation calculation inputs (entry price, leverage, maintenance margin) and draw that liquidation line relative to the instrument.
Geschütztes Skript
Dieses Script ist als Closed-Source veröffentlicht. Sie können es kostenlos und ohne Einschränkungen verwenden – erfahren Sie hier mehr.
Ücretsiz Telegram kanalımız :
t.me/kointakip
t.me/kointakip
Haftungsausschluss
Die Informationen und Veröffentlichungen sind nicht als Finanz-, Anlage-, Handels- oder andere Arten von Ratschlägen oder Empfehlungen gedacht, die von TradingView bereitgestellt oder gebilligt werden, und stellen diese nicht dar. Lesen Sie mehr in den Nutzungsbedingungen.