PROTECTED SOURCE SCRIPT
Aktualisiert Volume Spread Analysis — Educational (VSA Study)
Volume Spread Analysis — Educational (VSA Study)
Overview
This indicator is an educational tool based on classic Volume Spread Analysis (VSA), a methodology pioneered by Tom Williams. VSA studies the relationship between volume, price spread, and closing position to highlight the possible footprints of professional buying and selling.
The purpose of this study is to make the core VSA events visible on the chart, so traders can learn how to recognize them in real time. It does not provide signals, alerts, or advice — it is designed purely for market education and visual study.
What It Displays
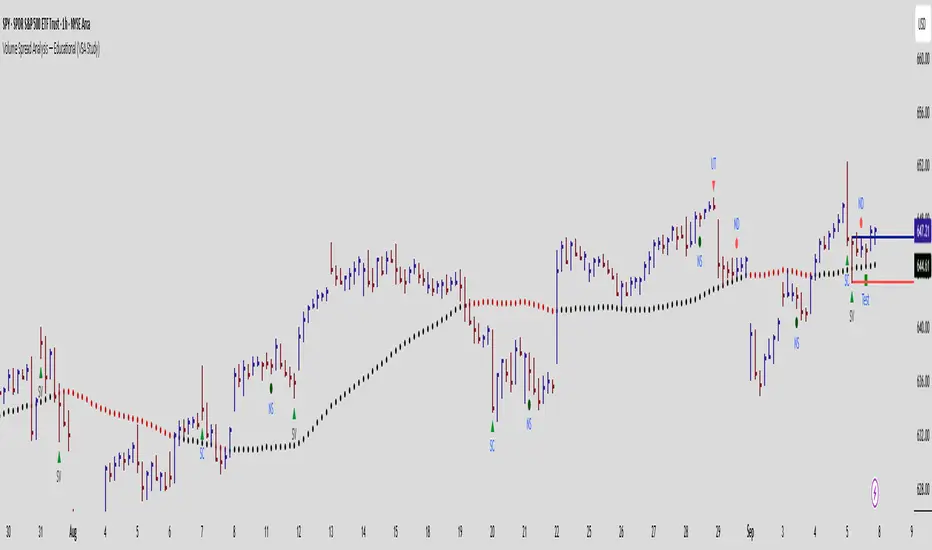
The script plots key VSA events as shapes on the chart:
Stopping Volume (SV): Wide down bar, ultra-high volume, closing off the lows.
Selling Climax (SC): Climactic selling into the lows, often at market bottoms.
Shakeout (SO): Sharp down bar that springs back and closes strong.
No Supply (NS): Narrow down bar on very low volume, showing lack of selling.
No Demand (ND): Narrow up bar on low volume, showing lack of buying interest.
Buying Climax (BC): Wide up bar with climactic volume, closing weak.
Upthrust (UT): False breakout above resistance that closes weak.
Supply Coming In: Signs of supply entering after an up-move.
End of Rising Market (EoRM): Narrow up bar with very high volume and weak close.
Test Bar: Low-volume down bar closing strong, testing for supply.
How It Works
Each event is identified by comparing:
Volume against its moving average.
Spread (bar range) against the average spread.
Closing position within the bar.
Wick structure (upper/lower shadow).
Trend context (short-term moving averages).
By combining these elements, the script highlights conditions that match classical VSA patterns.
An optional moving average can be enabled for background context — this is not a signal, only a visual guide to see whether price is trading above or below a simple average.
How to Use It (Educational)
As Tom Williams taught, VSA is about reading the background:
Signs of Strength: Look for Stopping Volume, Selling Climax, Shakeouts, and No Supply bars. These often appear after weakness and suggest buyers are stepping in.
Signs of Weakness: Watch for Buying Climaxes, Upthrusts, Supply Coming In, and End of Rising Market patterns. These often appear after strength and suggest sellers are active.
Context Matters:
Strength is best studied when price is above the moving average and holding above trigger zones.
Weakness is best studied when price is below the average and struggling under resistance.
Tests & No Demand: These confirm whether supply or demand is still present. A successful Test (low volume down bar, closing strong) often follows strength, while No Demand confirms weakness.
This script is not about trade entries — it is a learning tool to help traders visually study professional activity and market phases.
Originality
This is not a mash-up of public code. It is a purpose-built educational implementation of VSA logic, written from scratch. It maps directly to classical definitions of strength, weakness, tests, and climaxes, making the concepts easier to recognize without requiring traders to interpret raw formulas.
Disclaimer
This indicator is for educational and analytical purposes only.
It does not generate trading signals, alerts, or financial advice.
Always do your own research and risk management when trading.
Overview
This indicator is an educational tool based on classic Volume Spread Analysis (VSA), a methodology pioneered by Tom Williams. VSA studies the relationship between volume, price spread, and closing position to highlight the possible footprints of professional buying and selling.
The purpose of this study is to make the core VSA events visible on the chart, so traders can learn how to recognize them in real time. It does not provide signals, alerts, or advice — it is designed purely for market education and visual study.
What It Displays
The script plots key VSA events as shapes on the chart:
Stopping Volume (SV): Wide down bar, ultra-high volume, closing off the lows.
Selling Climax (SC): Climactic selling into the lows, often at market bottoms.
Shakeout (SO): Sharp down bar that springs back and closes strong.
No Supply (NS): Narrow down bar on very low volume, showing lack of selling.
No Demand (ND): Narrow up bar on low volume, showing lack of buying interest.
Buying Climax (BC): Wide up bar with climactic volume, closing weak.
Upthrust (UT): False breakout above resistance that closes weak.
Supply Coming In: Signs of supply entering after an up-move.
End of Rising Market (EoRM): Narrow up bar with very high volume and weak close.
Test Bar: Low-volume down bar closing strong, testing for supply.
How It Works
Each event is identified by comparing:
Volume against its moving average.
Spread (bar range) against the average spread.
Closing position within the bar.
Wick structure (upper/lower shadow).
Trend context (short-term moving averages).
By combining these elements, the script highlights conditions that match classical VSA patterns.
An optional moving average can be enabled for background context — this is not a signal, only a visual guide to see whether price is trading above or below a simple average.
How to Use It (Educational)
As Tom Williams taught, VSA is about reading the background:
Signs of Strength: Look for Stopping Volume, Selling Climax, Shakeouts, and No Supply bars. These often appear after weakness and suggest buyers are stepping in.
Signs of Weakness: Watch for Buying Climaxes, Upthrusts, Supply Coming In, and End of Rising Market patterns. These often appear after strength and suggest sellers are active.
Context Matters:
Strength is best studied when price is above the moving average and holding above trigger zones.
Weakness is best studied when price is below the average and struggling under resistance.
Tests & No Demand: These confirm whether supply or demand is still present. A successful Test (low volume down bar, closing strong) often follows strength, while No Demand confirms weakness.
This script is not about trade entries — it is a learning tool to help traders visually study professional activity and market phases.
Originality
This is not a mash-up of public code. It is a purpose-built educational implementation of VSA logic, written from scratch. It maps directly to classical definitions of strength, weakness, tests, and climaxes, making the concepts easier to recognize without requiring traders to interpret raw formulas.
Disclaimer
This indicator is for educational and analytical purposes only.
It does not generate trading signals, alerts, or financial advice.
Always do your own research and risk management when trading.
Versionshinweise
Volume Spread Analysis — Educational (VSA Study)This script is an educational tool designed to help traders study Volume Spread Analysis (VSA) concepts directly on their charts. It highlights potential signs of supply and demand, as well as provides a simple moving average (MA) context.
It is not a buy or sell signal generator, and it should not be used as financial advice. The purpose is to help users learn to recognize common VSA patterns and practice interpreting them in real time.
What the script shows
1. Custom Moving Average (always visible)
A 50-period Simple Moving Average (SMA) is plotted on the chart as a series of circles.
The color of the circles changes based on price relative to the MA:
Green = price closing above the MA.
Red = price closing below the MA.
This provides a quick visual guide to the broader market direction.
2. Context MAs (for trend background)
The script also calculates 30-period and 100-period SMAs.
These help determine whether the market is in a short-term uptrend or downtrend, which is used in some of the VSA conditions.
Uptrend: 5-period SMA is greater than the 10-period SMA.
Downtrend: 5-period SMA is less than the 10-period SMA.
3. VSA Event Conditions (plotted on candles)
The script looks for well-known VSA principles and marks them on the chart:
Selling Climax (SC) – Very high volume on a wide down bar closing near the low, possibly signaling selling pressure is being absorbed.
Shakeout (SO) – Wide down bar with very high volume that closes strong (near the high) and shows rejection of lower prices.
Stopping Volume (SV) – Down bar with high volume, closing in the upper part of the bar, suggesting buying support.
Buying Climax (BC) – Very wide up bar on high volume that closes near the high but often precedes weakness.
Upthrust (UT) – A bar that pushes above a prior high, then closes weak with a long upper wick, showing potential supply.
No Supply (NS) – Narrow down bar with low volume in an uptrend, often a sign of lack of selling pressure.
No Demand (ND) – Narrow up bar with low volume in a downtrend, often a sign of lack of buying interest.
End of Rising Market (EoRM) – Wide up bar with very high volume, narrow spread, and weakness into the close, often appearing before a reversal.
Each signal is marked with a clear shape and label directly on the price bar, for easy recognition.
4. Trigger Levels
When a major VSA event occurs (such as a Selling Climax, Upthrust, Supply Coming In, etc.), the script draws horizontal lines at the high and low of the signal bar.
These levels can act as reference zones for future support and resistance.
How to use
Add the script to your chart on Trading View.
Choose your desired symbol and time frame.
Watch the chart for:
The colored 50-period MA line to see if price is generally above (green) or below (red) its recent average.
Shapes and labels on candles that highlight potential VSA signals. Each label corresponds to one of the VSA principles listed above.
Horizontal lines that appear after strong VSA “trigger” bars. These can help you track important price zones.
Use the signals for educational study of VSA concepts, or as part of your own broader analysis. The signals are not intended to be traded blindly.
Settings
MA Length (50 by default) – Period for the main moving average line.
Volume and Spread Lookback (20 bars by default) – Used to calculate average and standard deviation for volume and spread.
ATR Length (14 by default) – Used for gap detection.
Gap Multiplier (0.7 by default) – Adjusts the threshold for what counts as a significant gap.
Disclaimer
This indicator is provided for educational purposes only. It is not financial advice. Trading and investing carry risk, and you are responsible for your own decisions. Always do your own research and use proper risk management.
Versionshinweise
updateGeschütztes Skript
Dieses Script ist als Closed-Source veröffentlicht. Sie können es kostenlos und ohne Einschränkungen verwenden – erfahren Sie hier mehr.
Haftungsausschluss
Die Informationen und Veröffentlichungen sind nicht als Finanz-, Anlage-, Handels- oder andere Arten von Ratschlägen oder Empfehlungen gedacht, die von TradingView bereitgestellt oder gebilligt werden, und stellen diese nicht dar. Lesen Sie mehr in den Nutzungsbedingungen.
Geschütztes Skript
Dieses Script ist als Closed-Source veröffentlicht. Sie können es kostenlos und ohne Einschränkungen verwenden – erfahren Sie hier mehr.
Haftungsausschluss
Die Informationen und Veröffentlichungen sind nicht als Finanz-, Anlage-, Handels- oder andere Arten von Ratschlägen oder Empfehlungen gedacht, die von TradingView bereitgestellt oder gebilligt werden, und stellen diese nicht dar. Lesen Sie mehr in den Nutzungsbedingungen.