Volatility-Adjusted Rate of Change (VARC) Model
1. CBOE Skew Index (SKEW) and ROC Calculation
At its core, the VARC model uses the CBOE Skew Index as a measure of market sentiment. The SKEW index represents the perceived risk of extreme negative movements in the S&P 500, providing insight into the balance of risks in the market (CBOE, 2021). This sentiment-based index is often used by traders and analysts to gauge the likelihood of a market downturn.
The Rate of Change (ROC) is applied to the Skew Index, calculated over a specified lookback period (rocLength = 29). The ROC measures the percentage change in price from one period to another and is widely used to gauge the momentum of an asset (Chande & Kroll, 1994). In the VARC model, the ROC of the Skew Index is employed to assess shifts in market sentiment that may signal turning points or potential volatility.
2. Volatility Adjustment
Volatility plays a significant role in market behavior and risk management. The VARC model uses a volatility-adjusted threshold to dynamically adjust the sensitivity of the trading signals. This is achieved by calculating the standard deviation of the ROC over a defined volatility lookback period (volatilityLookback = 20) and applying a volatility multiplier (volatilityMultiplier = 1.5). These parameters define upper and lower thresholds for trade entry and exit.
The model adjusts the sensitivity of the ROC signals based on market volatility, ensuring that the strategy adapts to changing market conditions. When volatility is high, the thresholds are widened, allowing the model to filter out noise and avoid unnecessary trades. Conversely, during periods of low volatility, the thresholds tighten, enabling the model to capture smaller price movements.
3. Entry and Exit Conditions
The VARC model generates trading signals based on the behavior of the ROC relative to the dynamically adjusted volatility thresholds. A long position is initiated when the ROC crosses below the lower threshold, indicating that the market is becoming oversold or showing signs of excessive pessimism. The position is closed when the ROC exceeds the upper threshold, signaling a potential reversal or a return to normal market conditions. These entry and exit conditions are defined as follows:
• Long Condition: The ROC is below the lower threshold (roc < dynamicThresholdLow).
• Exit Condition: The ROC is above the upper threshold (roc > dynamicThresholdHigh).
This approach provides a systematic method for entering and exiting positions based on volatility-adjusted momentum, helping traders to capitalize on shifts in market sentiment.
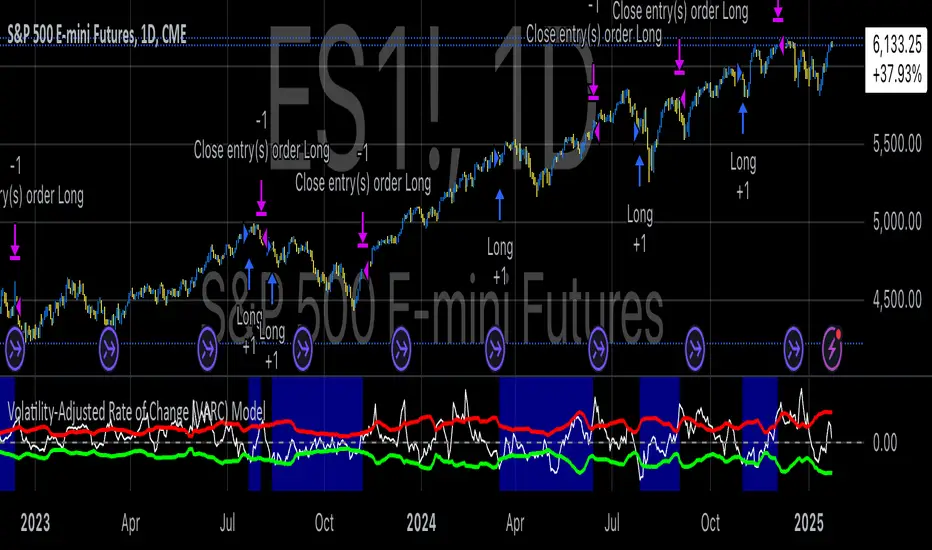
4. Visualization and Signal Highlighting
The model includes several visual aids to help traders interpret the signals. The ROC, dynamic thresholds, and a zero line are plotted on the chart to provide a clear representation of market momentum and the current trading range. Furthermore, a background color is used to highlight periods when a position is open, visually reinforcing the model’s decisions.
5. Conclusion
The VARC model offers a robust framework for trading by combining momentum (through the ROC) with a volatility-adjusted approach that refines trade signals based on market conditions. The use of the CBOE Skew Index adds an additional layer of market sentiment analysis, providing context to the ROC values. This volatility-adaptive strategy offers traders a more nuanced way to navigate the markets, making it suitable for both short-term and longer-term trading horizons.
References:
• CBOE. (2021). CBOE Skew Index (SKEW). Chicago Board Options Exchange. Retrieved from cboe.com
• Chande, T., & Kroll, J. (1994). The New Technical Trader: Boost Your Profit by Plugging into the Latest Indicators. Wiley.
This model can be particularly useful in volatile markets, where traditional fixed thresholds may not perform as well. By adjusting the thresholds dynamically based on the underlying volatility, the VARC model offers a more flexible and responsive approach to market trading.
Skript nur auf Einladung
Ausschließlich Nutzer mit einer Erlaubnis des Autors können Zugriff auf dieses Script erhalten. Sie müssen diese Genehmigung bei dem Autor beantragen. Dies umfasst üblicherweise auch eine Zahlung. Wenn Sie mehr erfahren möchten, dann sehen Sie sich unten die Anweisungen des Autors an oder kontaktieren Sie EdgeTools direkt.
TradingView empfiehlt NICHT, für die Nutzung eines Scripts zu bezahlen, wenn Sie den Autor nicht als vertrauenswürdig halten und verstehen, wie das Script funktioniert. Sie können außerdem auch kostenlose Open-Source-Alternativen in unseren Community-Scripts finden.
Hinweise des Autors
edgetools.org
Haftungsausschluss
Skript nur auf Einladung
Ausschließlich Nutzer mit einer Erlaubnis des Autors können Zugriff auf dieses Script erhalten. Sie müssen diese Genehmigung bei dem Autor beantragen. Dies umfasst üblicherweise auch eine Zahlung. Wenn Sie mehr erfahren möchten, dann sehen Sie sich unten die Anweisungen des Autors an oder kontaktieren Sie EdgeTools direkt.
TradingView empfiehlt NICHT, für die Nutzung eines Scripts zu bezahlen, wenn Sie den Autor nicht als vertrauenswürdig halten und verstehen, wie das Script funktioniert. Sie können außerdem auch kostenlose Open-Source-Alternativen in unseren Community-Scripts finden.
Hinweise des Autors
edgetools.org