OPEN-SOURCE SCRIPT
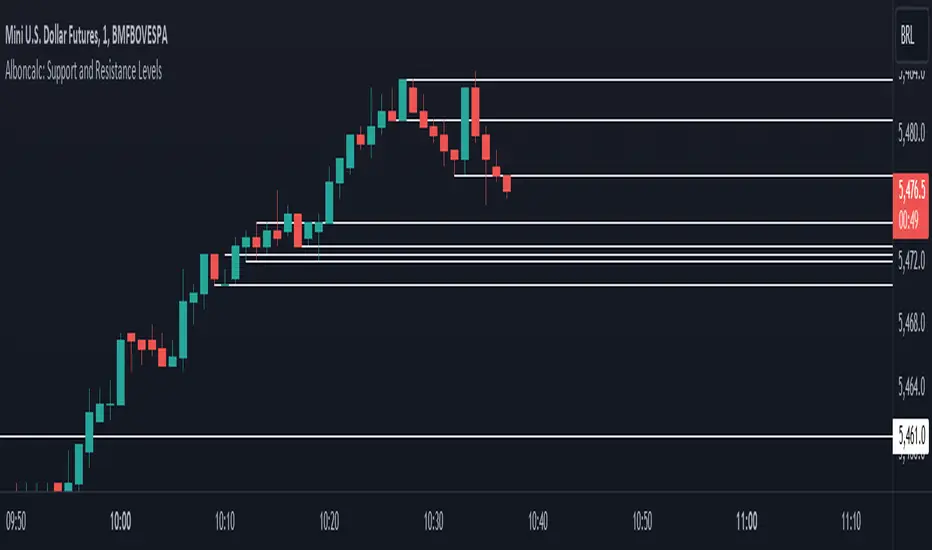
Alboncalc: Support and Resistance Levels
Alboncalc: Support and Resistance Levels
Description:
Alboncalc is an innovative TradingView indicator that identifies significant support and resistance levels based on patterns where two candles form equal highs and/or lows. This indicator automatically plots these critical levels on the chart, providing traders with clear visual cues of potential price reversal or consolidation points.
Originality and Usefulness:
Alboncalc stands out for its ability to detect specific candle patterns that indicate support and resistance, setting it apart from traditional support and resistance indicators. This specific method of price action analysis offers a unique and refined perspective for traders, adding value to the body of knowledge within the TradingView community.
How It Works:
Alboncalc analyzes historical prices to identify where two consecutive candles achieve equal highs or lows. When these conditions are met, the indicator automatically plots a support or resistance line on the chart. These levels are dynamically updated, ensuring that traders always have the most relevant and accurate information.
How to Use:
Installation: Add Alboncalc to your chart on TradingView.
Interpretation: Observe the plotted support and resistance lines. These lines indicate potential reversal or consolidation points.
Application: Use these levels to confirm breakout points or identify areas of price exhaustion. The clear visualization of technical levels helps enhance your trading strategies.
Underlying Concepts:
Alboncalc is based on price action analysis, focusing on specific candle patterns that signal important technical levels. The formation of two candles with equal highs or lows indicates a temporary balance between buyers and sellers, suggesting potential price direction changes.
Open-source Skript
Ganz im Sinne von TradingView hat dieser Autor sein/ihr Script als Open-Source veröffentlicht. Auf diese Weise können nun auch andere Trader das Script rezensieren und die Funktionalität überprüfen. Vielen Dank an den Autor! Sie können das Script kostenlos verwenden, aber eine Wiederveröffentlichung des Codes unterliegt unseren Hausregeln.
Haftungsausschluss
Die Informationen und Veröffentlichungen sind nicht als Finanz-, Anlage-, Handels- oder andere Arten von Ratschlägen oder Empfehlungen gedacht, die von TradingView bereitgestellt oder gebilligt werden, und stellen diese nicht dar. Lesen Sie mehr in den Nutzungsbedingungen.