OPEN-SOURCE SCRIPT
slope-velocity

Description
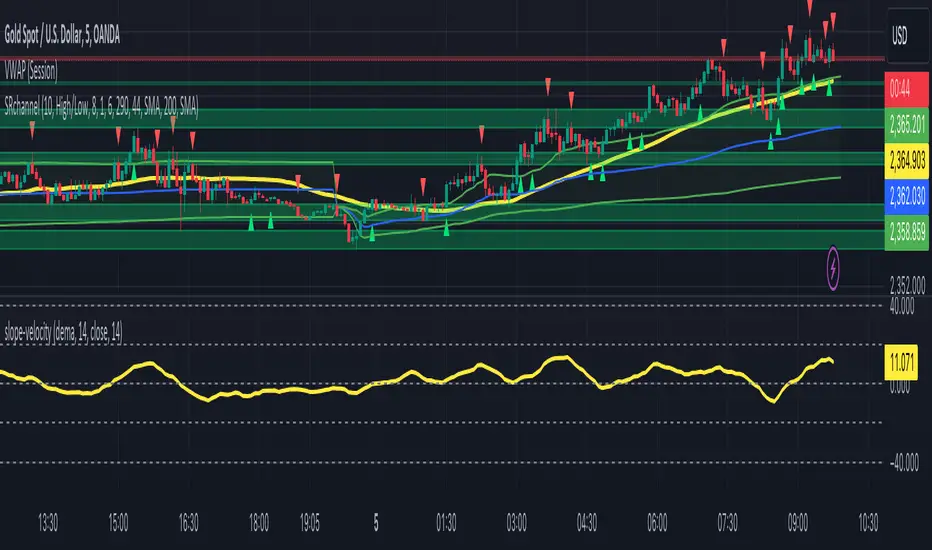
This Pine Script indicator, named "slope-velocity," calculates and visualizes the slope of a moving average (MA) in degrees, allowing users to observe the rate of change of the MA over time. Here's a breakdown of its components and functionality:
Inputs:
option: A dropdown menu allowing the user to select the type of moving average (SMA, EMA, DEMA).
length: An integer input for specifying the period length of the moving average.
source: The data source for the moving average calculation, defaulting to the close price.
Variable Initialization:
ma: A variable to store the moving average value, initialized as na.
Moving Average Calculation:
Depending on the selected option, the script calculates the appropriate moving average:
ta.sma(source, length) for Simple Moving Average (SMA).
ta.ema(source, length) for Exponential Moving Average (EMA).
ta.dema(source, length) for Double Exponential Moving Average (DEMA).
Slope Calculation:
slope_ma: The script calculates the slope of the moving average by subtracting the previous period's MA value from the current period's MA value (ma - ma[1]).
Slope Conversion to Degrees:
slope_degrees_ma: The slope is converted to degrees using the math.atan function to compute the arctangent of the slope, followed by math.todegrees to convert the result from radians to degrees. The result is rounded to the nearest integer using math.round.
Plotting Reference Lines:
Horizontal lines are plotted at specific degree values (0, 10, 20, -10, -20) to provide reference points for the slope's visualization.
Plotting the Slope:
The slope in degrees is plotted as a histogram. The color of the histogram bars is determined by the sign of the slope: green for positive slopes and red for negative slopes.
Additional Comments
The script includes some commented-out sections related to plotting acceleration and displaying labels for slope differences, which are not active in the current implementation.
The script is designed to provide a visual representation of the moving average's rate of change, making it easier to identify periods of rapid price movement and potential trend reversals.
Open-source Skript
Ganz im Sinne von TradingView hat dieser Autor sein/ihr Script als Open-Source veröffentlicht. Auf diese Weise können nun das Script auch andere Trader verstehen und prüfen. Vielen Dank an den Autor! Sie können das Script kostenlos verwenden. Die Nutzung dieses Codes in einer Veröffentlichung wird in unseren Hausregeln reguliert. Sie können es als Favoriten auswählen, um es in einem Chart zu verwenden.
Möchten Sie dieses Skript auf einem Chart verwenden?
Haftungsausschluss
Die Informationen und Veröffentlichungen sind nicht als Finanz-, Anlage-, Handels- oder andere Arten von Ratschlägen oder Empfehlungen gedacht, die von TradingView bereitgestellt oder gebilligt werden, und stellen diese nicht dar. Lesen Sie mehr in den Nutzungsbedingungen.