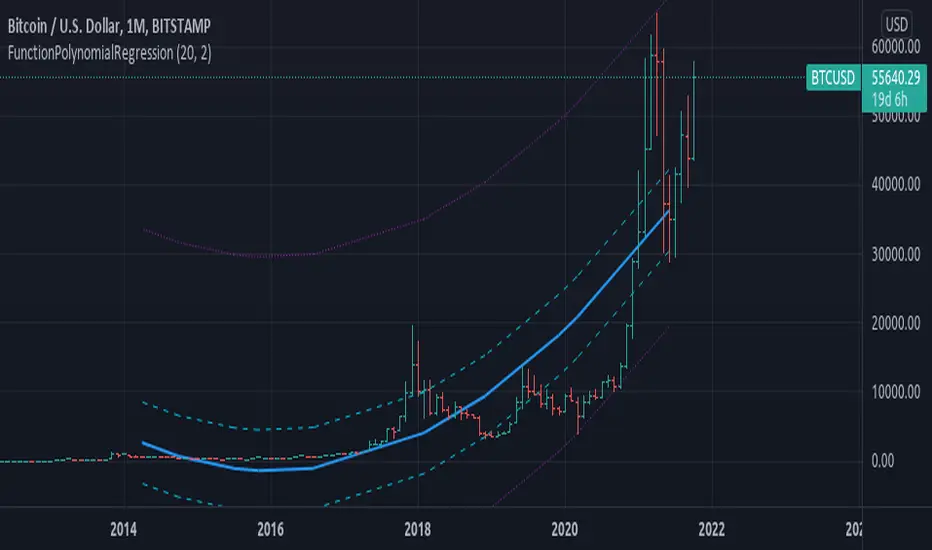
FunctionPolynomialRegression

TODO:
polyreg(sample_x, sample_y) Method to return a polynomial regression channel using (X,Y) sample points.
Parameters:
sample_x: float array, sample data X points.
sample_y: float array, sample data Y points.
Returns: tuple with:
_predictions: Array with adjusted Y values.
_max_dev: Max deviation from the mean.
_min_dev: Min deviation from the mean.
_stdev/_sizeX: Average deviation from the mean.
draw(sample_x, sample_y, extend, mid_color, mid_style, mid_width, std_color, std_style, std_width, max_color, max_style, max_width) Method for drawing the Polynomial Regression into chart.
Parameters:
sample_x: float array, sample point X value.
sample_y: float array, sample point Y value.
extend: string, default=extend.none, extend lines.
mid_color: color, default=color.blue, middle line color.
mid_style: string, default=line.style_solid, middle line style.
mid_width: int, default=2, middle line width.
std_color: color, default=color.aqua, standard deviation line color.
std_style: string, default=line.style_dashed, standard deviation line style.
std_width: int, default=1, standard deviation line width.
max_color: color, default=color.purple, max range line color.
max_style: string, default=line.style_dotted, max line style.
max_width: int, default=1, max line width.
Returns: line array.
Pine Bibliothek
Ganz im Sinne von TradingView hat dieser Autor seinen/ihren Pine Code als Open-Source-Bibliothek veröffentlicht. Auf diese Weise können nun auch andere Pine-Programmierer aus unserer Community den Code verwenden. Vielen Dank an den Autor! Sie können diese Bibliothek privat oder in anderen Open-Source-Veröffentlichungen verwenden. Die Nutzung dieses Codes in einer Veröffentlichung wird in unseren Hausregeln reguliert.
Haftungsausschluss
Pine Bibliothek
Ganz im Sinne von TradingView hat dieser Autor seinen/ihren Pine Code als Open-Source-Bibliothek veröffentlicht. Auf diese Weise können nun auch andere Pine-Programmierer aus unserer Community den Code verwenden. Vielen Dank an den Autor! Sie können diese Bibliothek privat oder in anderen Open-Source-Veröffentlichungen verwenden. Die Nutzung dieses Codes in einer Veröffentlichung wird in unseren Hausregeln reguliert.