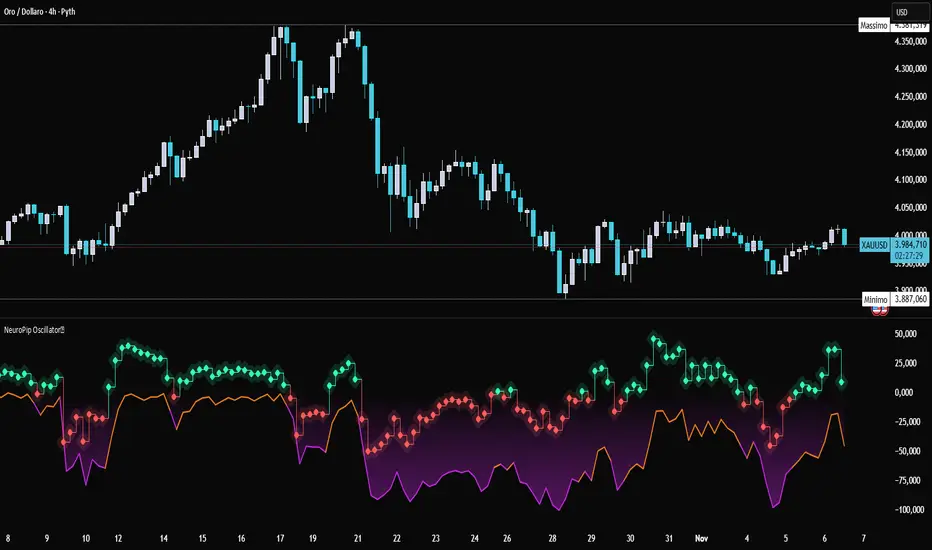
NeuroPip Oscillator
Indicator published by PipGuard.
NeuroPip Oscillator is an adaptive momentum oscillator displayed in a separate panel, designed to read market momentum and regime shifts through a dynamically adjusted signal line.
The main signal (NeuroPulse) changes color according to the active regime, while the Synapse Burst line highlights real-time deviations and momentum acceleration phases.
How it Works
• Non-Classical Logic:
Unlike conventional 3-candle swing models, NeuroPip uses a custom adaptive mechanism that blends trend behavior, volatility, and closing dynamics over a dynamic bar range.
This allows the oscillator to filter noise and focus on true structural impulses, rather than random fluctuations, producing smoother and more reliable regime detection.
• Color Shift & Waves:
The NeuroPulse line turns orange in bullish phases and violet in bearish phases.
A Colour fill between the signal and baseline visually represents the intensity and direction of momentum in real time.
• Synapse Burst (Active Deviation):
The Synapse Burst line measures the distance between the momentum curve and its adaptive baseline, revealing acceleration "bursts" or momentum drops as they occur.
How to Use
1. Add the oscillator to your chart (separate panel).
2. Read the color of the signal to determine the current market regime (bullish/bearish).
3. Observe the wave strength to gauge momentum continuity and pressure.
4. Use Synapse Burst spikes to confirm acceleration or deceleration in price movement.
5. Combine its insights with your risk management and main chart analysis.
EXAMPLE OF USE
EXAMPLE OF USE
Settings
• All parameters are internally preconfigured for stability and visual consistency.
• Colors and waves are optimized and not user-editable.
• Works on all markets and timeframes (panel overlay=false).
Alerts (Recommended to Enable)
Two built-in alerts trigger on bar close when the regime changes:
• Bullish Cross → signal turning bullish.
• Bearish Cross → signal turning bearish.
Each alert includes the symbol and timeframe, ensuring you never miss a regime shift even when you’re away from the screen.
Limitations
• The oscillator confirms regime changes; it does not predict them.
• In low-volatility environments, transitions may appear more frequent.
• Past performance does not guarantee future results.
Access
This script is available under invite-only access.
To request access, use the link provided in the Signature below the publication.
Note: Technical analysis tool designed to study price momentum and structure. It does not constitute financial advice or guarantee performance.
Indicator published by PipGuard.
Skript nur auf Einladung
Ausschließlich Nutzer mit einer Erlaubnis des Autors können Zugriff auf dieses Script erhalten. Sie müssen diese Genehmigung bei dem Autor beantragen. Dies umfasst üblicherweise auch eine Zahlung. Wenn Sie mehr erfahren möchten, dann sehen Sie sich unten die Anweisungen des Autors an oder kontaktieren Sie PipGuard direkt.
TradingView empfiehlt NICHT, für die Nutzung eines Scripts zu bezahlen, wenn Sie den Autor nicht als vertrauenswürdig halten und verstehen, wie das Script funktioniert. Sie können außerdem auch kostenlose Open-Source-Alternativen in unseren Community-Scripts finden.
Hinweise des Autors
PipGuard™ t.me/PipGuard
Haftungsausschluss
Skript nur auf Einladung
Ausschließlich Nutzer mit einer Erlaubnis des Autors können Zugriff auf dieses Script erhalten. Sie müssen diese Genehmigung bei dem Autor beantragen. Dies umfasst üblicherweise auch eine Zahlung. Wenn Sie mehr erfahren möchten, dann sehen Sie sich unten die Anweisungen des Autors an oder kontaktieren Sie PipGuard direkt.
TradingView empfiehlt NICHT, für die Nutzung eines Scripts zu bezahlen, wenn Sie den Autor nicht als vertrauenswürdig halten und verstehen, wie das Script funktioniert. Sie können außerdem auch kostenlose Open-Source-Alternativen in unseren Community-Scripts finden.
Hinweise des Autors
PipGuard™ t.me/PipGuard