PROTECTED SOURCE SCRIPT
Aktualisiert Multi Time Frame - Trade Setup ( MTF-TS )
This is Beta version of the Indicator and works on Multi Time Frame Analysis with Hybrid Moving Averages and RSI
Applicability : Index Trading / Equities and on proper analysis you may use it for Option Trading also.
As part of the Indicator there are 4 Choices that the user can opt for
Show Intraday Trades - This works for Intraday Trades - when the resolution is kept to less than 1 hour ( Say 3 , 5 , 10 , 15 Mins)
Show Short Term Trades - This works well when the resolution is kept to 1 Day - Good for Swing Trades spanning over a few days
Show Long Term Trades - This works well when the resolution is kept to 1 Day or Week - Good for Investments
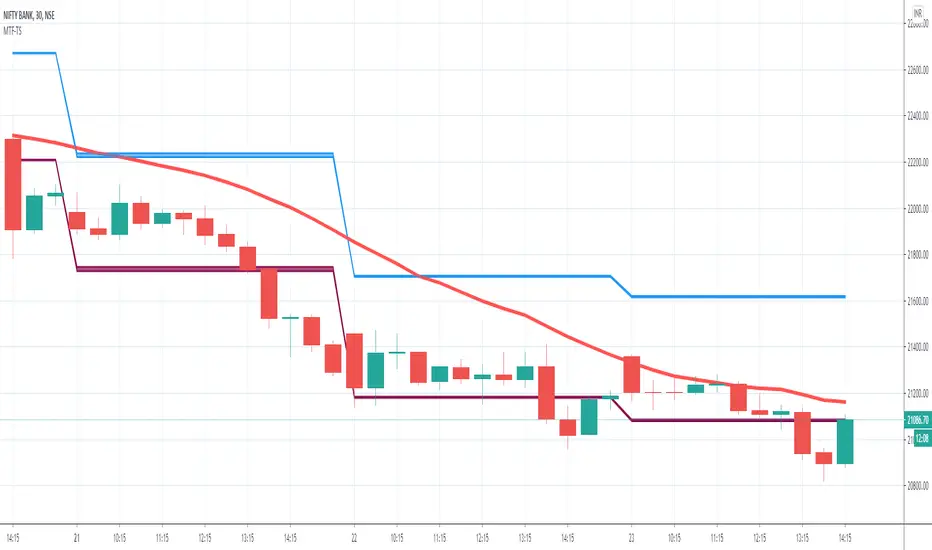
Show Trend Line - Will show the user the Simple Moving Average 20 based on the resolution selected , The Trend Line Is a repainted based on the hybrid RSI Logic
The Trend Line would show in three colours
Green : The Setup is in Up Trend- Try to take the trade as closer to the band as possible and when it continues to be in green ( and recommended when it would have just crossed from Red/Yellow to Green )
Red : The Setup is in Down Trend - Try to take the trade as closer to the band as possible and when it continues to be in red ( and recommended when it would have just crossed from Green/Yellow to Red )
Yellow : The Setup in sideways Trend
Visual Checks - It is always recommended to enter/exit the trade it it touches crosses over the Trend Line from one side to the other
When closer to the support resistance bands , wait for a confirmation candle to determine if you are getting resistance breakout / support or breakdown
Stop Loss - That should be done by following ones risk appetite , Ideally the open/close of the previous candle should be the stop loss for the buy/sell
but everyone has their own Risk Management Strategies based on the capital deployed.
Disclaimer : There could be scenarios when the breakout/breakdown candle is rejected , especially when it is long one
so it is always recommended to have a confirmation candle that open-closes above the breakout candle / open-closes below the breakdown candle
If you like it and find it useful or if you find a defect or bug , Please let us know in the comments .. that would encouraging !! for us to develop it further
Thank you and have a beautiful trading session !
Applicability : Index Trading / Equities and on proper analysis you may use it for Option Trading also.
As part of the Indicator there are 4 Choices that the user can opt for
Show Intraday Trades - This works for Intraday Trades - when the resolution is kept to less than 1 hour ( Say 3 , 5 , 10 , 15 Mins)
Show Short Term Trades - This works well when the resolution is kept to 1 Day - Good for Swing Trades spanning over a few days
Show Long Term Trades - This works well when the resolution is kept to 1 Day or Week - Good for Investments
Show Trend Line - Will show the user the Simple Moving Average 20 based on the resolution selected , The Trend Line Is a repainted based on the hybrid RSI Logic
The Trend Line would show in three colours
Green : The Setup is in Up Trend- Try to take the trade as closer to the band as possible and when it continues to be in green ( and recommended when it would have just crossed from Red/Yellow to Green )
Red : The Setup is in Down Trend - Try to take the trade as closer to the band as possible and when it continues to be in red ( and recommended when it would have just crossed from Green/Yellow to Red )
Yellow : The Setup in sideways Trend
Visual Checks - It is always recommended to enter/exit the trade it it touches crosses over the Trend Line from one side to the other
When closer to the support resistance bands , wait for a confirmation candle to determine if you are getting resistance breakout / support or breakdown
Stop Loss - That should be done by following ones risk appetite , Ideally the open/close of the previous candle should be the stop loss for the buy/sell
but everyone has their own Risk Management Strategies based on the capital deployed.
Disclaimer : There could be scenarios when the breakout/breakdown candle is rejected , especially when it is long one
so it is always recommended to have a confirmation candle that open-closes above the breakout candle / open-closes below the breakdown candle
If you like it and find it useful or if you find a defect or bug , Please let us know in the comments .. that would encouraging !! for us to develop it further
Thank you and have a beautiful trading session !
Versionshinweise
Update in Settings :As part of the Indicator settings there are 4 Choices that the user can opt for
Show Intraday SR - This works for Intraday Trades - when the resolution is kept to less than 1 hour ( Say 3 , 5 , 10 , 15 Mins)
The Support and Resistance Zone are shown at the Intraday levels
Show Short Term SR - This works well when the resolution is kept to 1 Day - Good for Swing Trades spanning over a few days
The Support and Resistance Zone are shown at the Short Term levels
Show Long Term SR - This works well when the resolution is kept to 1 Day or Week - Good for Investments
The Support and Resistance Zone are shown at the Long Term levels
Show Trend Line - Will show the user the Simple Moving Average 20 based on the resolution selected , The Trend Line Is a repainted based on the hybrid RSI Logic
The Trend Line would show in three colours
Green : The Setup is in Up Trend- Try to take the trade as closer to the band as possible and when it continues to be in green ( and recommended when it would have just crossed from Red/Yellow to Green )
Red : The Setup is in Down Trend - Try to take the trade as closer to the band as possible and when it continues to be in red ( and recommended when it would have just crossed from Green/Yellow to Red )
Yellow : The Setup in sideways Trend
Versionshinweise
Cosmetic Fixes. Label UpdatesVersionshinweise
Version Update : Remove the Invalid Settings on Plot Section
Versionshinweise
Updated Fixes On Plots based on feedback Versionshinweise
Updated to the Plot LogicAddition of the Execution Key
Update the Codebase to V4
Versionshinweise
Release Notes : 30th Aug 2020Updated Plot Settings and Duration
Cosmetic Changes
Versionshinweise
Version Update : Updated SettingsVersionshinweise
Update : 16-09 : Updated Code for Rule based changes ..Versionshinweise
Updated Date Validation Conditions Geschütztes Skript
Dieses Script ist als Closed-Source veröffentlicht. Sie können es kostenlos und ohne Einschränkungen verwenden – erfahren Sie hier mehr.
Haftungsausschluss
Die Informationen und Veröffentlichungen sind nicht als Finanz-, Anlage-, Handels- oder andere Arten von Ratschlägen oder Empfehlungen gedacht, die von TradingView bereitgestellt oder gebilligt werden, und stellen diese nicht dar. Lesen Sie mehr in den Nutzungsbedingungen.
Geschütztes Skript
Dieses Script ist als Closed-Source veröffentlicht. Sie können es kostenlos und ohne Einschränkungen verwenden – erfahren Sie hier mehr.
Haftungsausschluss
Die Informationen und Veröffentlichungen sind nicht als Finanz-, Anlage-, Handels- oder andere Arten von Ratschlägen oder Empfehlungen gedacht, die von TradingView bereitgestellt oder gebilligt werden, und stellen diese nicht dar. Lesen Sie mehr in den Nutzungsbedingungen.