PROTECTED SOURCE SCRIPT
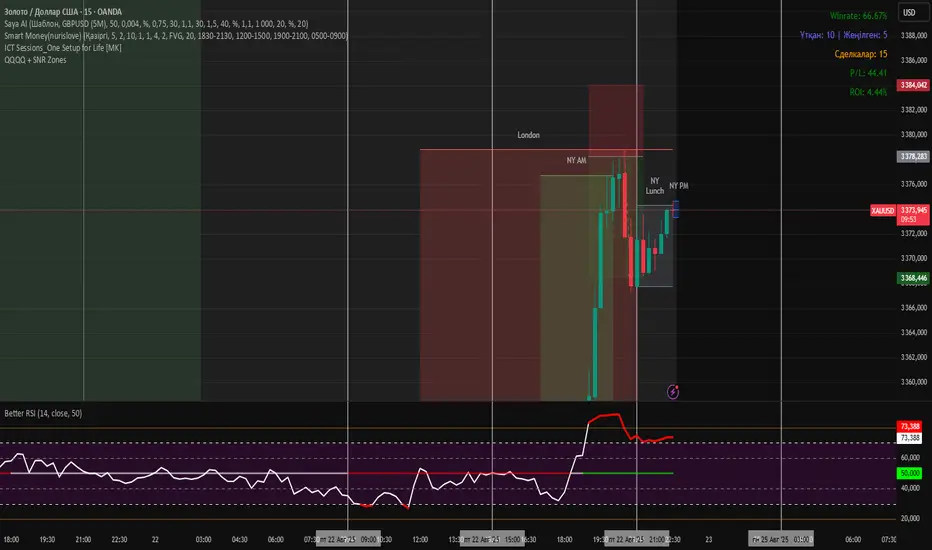
QQQQ 1W-1D Zhumabayevv

// === QQQQ Zone бөлігі ===
phaseDay = 24 * 60 * 60 * 1000
phase6h = 6 * 60 * 60 * 1000
week = 7 * phaseDay
getWeekStart() =>
dow = dayofweek
shift = (dow == dayofweek.sunday and hour >= 18) ? 0 : (dow == dayofweek.sunday ? -6 : 1 - dow)
timestamp("America/New_York", year, month, dayofmonth + shift, 18, 0)
var int weekStart = na
if na(weekStart) or time > weekStart + week
weekStart := getWeekStart()
isInQ1 = false
isInQ2 = false
isInQ3 = false
isInQ4 = false
showQ1 = false
showQ2 = false
showQ3 = false
showQ4 = false
for w = -1 to 2
baseTime = weekStart + w * week
for q = 0 to 3
qStart = baseTime + q * phaseDay
qEnd = qStart + phaseDay
inQ = time >= qStart and time < qEnd
if q == 0
isInQ1 := isInQ1 or inQ
showQ1 := showQ1 or (time == qStart)
if q == 1
isInQ2 := isInQ2 or inQ
showQ2 := showQ2 or (time == qStart)
if q == 2
isInQ3 := isInQ3 or inQ
showQ3 := showQ3 or (time == qStart)
if q == 3
isInQ4 := isInQ4 or inQ
showQ4 := showQ4 or (time == qStart)
for i = 1 to 3
t = qStart + i * phase6h
line.new(x1=t, y1=low, x2=t, y2=high, xloc=xloc.bar_time, extend=extend.both, color=color.gray, style=line.style_dashed, width=1)
plotshape(showQ1, location=location.top, style=shape.labelup, text="Q1", color=color.white, textcolor=color.black, size=size.tiny)
plotshape(showQ2, location=location.top, style=shape.labelup, text="Q2", color=color.white, textcolor=color.black, size=size.tiny)
plotshape(showQ3, location=location.top, style=shape.labelup, text="Q3", color=color.white, textcolor=color.black, size=size.tiny)
plotshape(showQ4, location=location.top, style=shape.labelup, text="Q4", color=color.white, textcolor=color.black, size=size.tiny)
bgColor = isInQ1 ? color.new(color.blue, 85) :
isInQ2 ? color.new(color.orange, 85) :
isInQ3 ? color.new(color.red, 85) :
isInQ4 ? color.new(color.green, 85) : na
bgcolor(bgColor)
Geschütztes Skript
Dieses Script ist als Closed-Source veröffentlicht. Sie können es kostenlos und ohne Einschränkungen verwenden – erfahren Sie hier mehr.
Haftungsausschluss
Die Informationen und Veröffentlichungen sind nicht als Finanz-, Anlage-, Handels- oder andere Arten von Ratschlägen oder Empfehlungen gedacht, die von TradingView bereitgestellt oder gebilligt werden, und stellen diese nicht dar. Lesen Sie mehr in den Nutzungsbedingungen.