PROTECTED SOURCE SCRIPT
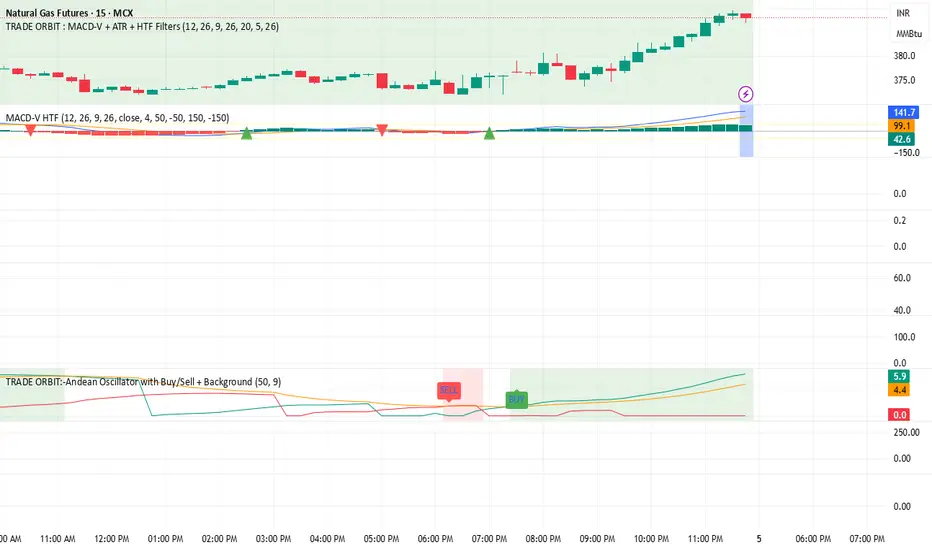
TRADE ORBIT:-Andean Oscillator with Buy/Sell + Background
//=============================================================================
// DESCRIPTION
//-----------------------------------------------------------------------------
// The Andean Oscillator is a trend-momentum tool that compares bullish and
// bearish pressure using dynamic envelopes derived from price. It evaluates
// the strength of upward vs downward movement and generates trade signals
// when bullish or bearish momentum aligns above a smoothed signal line.
//
// COMPONENTS
// -----------
// • Bull : Represents bullish pressure
// • Bear : Represents bearish pressure
// • Signal: EMA smoothing of the stronger of Bull/Bear
//
// SIGNAL LOGIC
// -------------
// ✅ BUY signal is generated when:
// 1) Bull crosses above Bear
// 2) Bull then crosses above the Signal line
//
// ✅ SELL signal is generated when:
// 1) Bear crosses above Bull
// 2) Bear then crosses above the Signal line
//
// BACKGROUND COLORS
// -----------------
// • Green background → Bull > Bear and Bull > Signal
// • Red background → Bear > Bull and Bear > Signal
//
// PLOTS
// -----
// • Green plot → Bullish component
// • Red plot → Bearish component
// • Orange plot → Signal line
//
// ADDITIONAL NOTES
// ----------------
// • Uses envelope calculation with EMA smoothing
// • State-tracking ensures proper trend recognition
// • Alert conditions are included for Buy and Sell signals
//
//=============================================================================
Geschütztes Skript
Dieses Script ist als Closed-Source veröffentlicht. Sie können es kostenlos und ohne Einschränkungen verwenden – erfahren Sie hier mehr.
Haftungsausschluss
Die Informationen und Veröffentlichungen sind nicht als Finanz-, Anlage-, Handels- oder andere Arten von Ratschlägen oder Empfehlungen gedacht, die von TradingView bereitgestellt oder gebilligt werden, und stellen diese nicht dar. Lesen Sie mehr in den Nutzungsbedingungen.