PROTECTED SOURCE SCRIPT
Aktualisiert RVI SD Band Oscillator | BinMasta
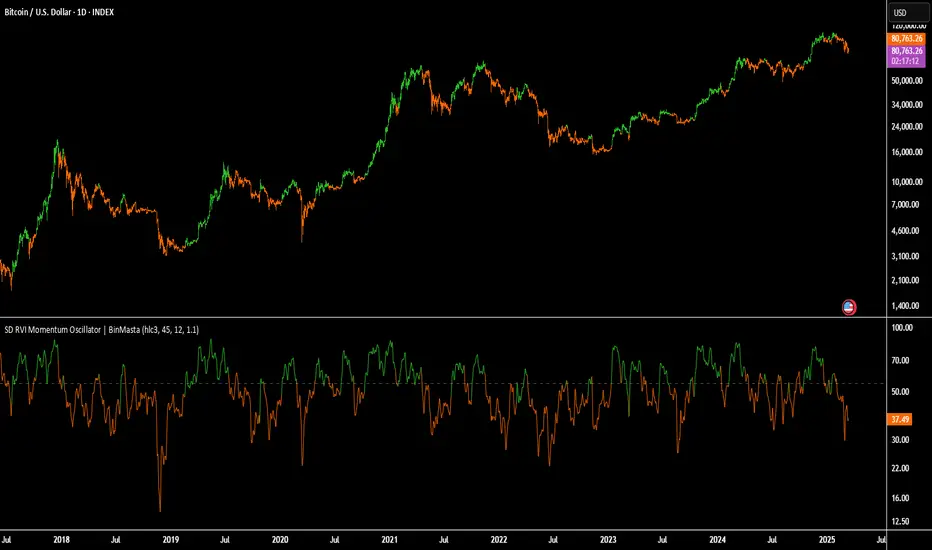
The RVI SD Band Oscillator is a momentum-based indicator that enhances trend analysis using the Relative Vigor Index (RVI) with Standard Deviation (SD) Bands. It refines signals by incorporating a signal line and dynamically adjusting bands based on market volatility.
Core Components:
RVI Calculation: Measures price momentum relative to past movements.
Signal Line: A smoothed version of RVI to identify crossovers.
SD Bands: Standard deviation-based boundaries to gauge overbought/oversold conditions.
Trading Logic:
Trend Direction: Determined by RVI crossover with the signal line.
Momentum Confirmation: Identifies shifts in buying and selling strength.
Trade Signals:
Bullish when the trend is up & the signal is near the lower band.
Bearish when the trend is down & the signal is near the upper band.
Visual Features:
Colored candles highlight potential trend shifts.
Signal line plot provides additional confirmation.
Disclaimer:
This indicator is for educational purposes only and should not be considered financial advice. Past performance is not indicative of future results. Always conduct your own analysis and risk management before making trading decisions. 🚀
Versionshinweise
The RVI SD Band Oscillator is a momentum-based indicator that enhances trend analysis using the Relative Vigor Index (RVI) with Standard Deviation (SD) Bands. It refines signals by incorporating a signal line and dynamically adjusting bands based on market volatility.Core Components:
RVI Calculation: Measures price momentum relative to past movements.
Signal Line: A smoothed version of RVI to identify crossovers.
SD Bands: Standard deviation-based boundaries to gauge overbought/oversold conditions.
Trading Logic:
Trend Direction: Determined by RVI crossover with the signal line.
Momentum Confirmation: Identifies shifts in buying and selling strength.
Trade Signals:
Bullish when the trend is up & the signal is near the lower band.
Bearish when the trend is down & the signal is near the upper band.
Visual Features:
Colored candles highlight potential trend shifts.
Signal line plot provides additional confirmation.
Disclaimer:
This indicator is for educational purposes only and should not be considered financial advice. Past performance is not indicative of future results. Always conduct your own analysis and risk management before making trading decisions. 🚀
Geschütztes Skript
Dieses Script ist als Closed-Source veröffentlicht. Sie können es kostenlos und ohne Einschränkungen verwenden – erfahren Sie hier mehr.
Haftungsausschluss
Die Informationen und Veröffentlichungen sind nicht als Finanz-, Anlage-, Handels- oder andere Arten von Ratschlägen oder Empfehlungen gedacht, die von TradingView bereitgestellt oder gebilligt werden, und stellen diese nicht dar. Lesen Sie mehr in den Nutzungsbedingungen.