High Volume Key Hidden Level
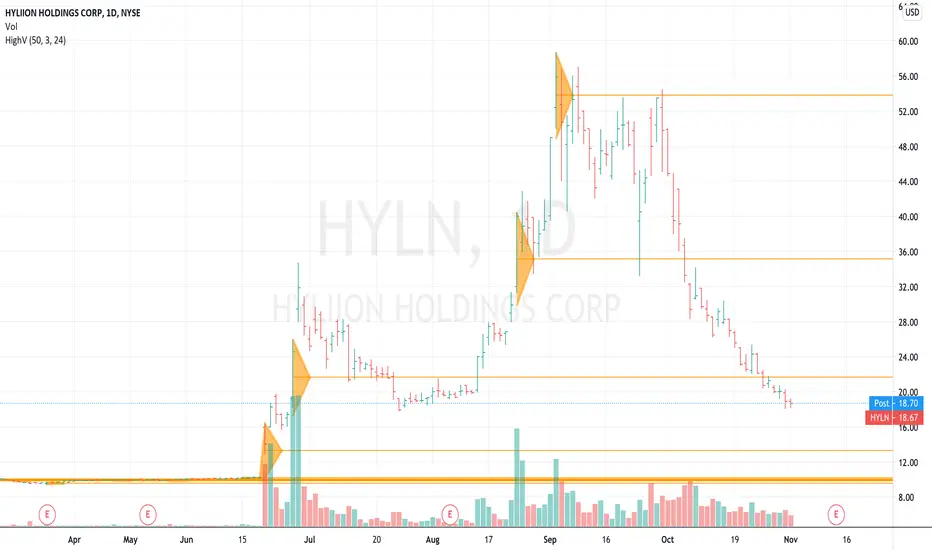
Generally speaking, if the market rallies into a line then look for the market to stall at the line as it is a level of supply. Likewise, if the market falls down to a high volume level, then it would be logical to assume there is support at that level especially on the first and second revisit.
The indicator is adjustable so you can filter out to whatever multiple of any average. Some markets rarely have 3-times volume events, so you may have to adjust for each symbol.
High volume events indicate that news or an event has occured and should mark an important level where traders and investors may be interested in trading at that level again.
I would consider an uptrend to be in tact when the market is above the latest "high volume bar" and in a downtrend when the market is under the latest "high volume bar".
We use green triangles to plot earnings-release dates and blue triangles for dividends, yellow triangles for range expansion moves and black triangles for emotions (good and bad emotions such has fear and excitement).
Skript nur auf Einladung
Ausschließlich Nutzer mit einer Erlaubnis des Autors können Zugriff auf dieses Script erhalten. Sie müssen diese Genehmigung bei dem Autor beantragen. Dies umfasst üblicherweise auch eine Zahlung. Wenn Sie mehr erfahren möchten, dann sehen Sie sich unten die Anweisungen des Autors an oder kontaktieren Sie timwest direkt.
TradingView empfiehlt NICHT, für die Nutzung eines Scripts zu bezahlen, wenn Sie den Autor nicht als vertrauenswürdig halten und verstehen, wie das Script funktioniert. Sie können außerdem auch kostenlose Open-Source-Alternativen in unseren Community-Scripts finden.
Hinweise des Autors
Haftungsausschluss
Skript nur auf Einladung
Ausschließlich Nutzer mit einer Erlaubnis des Autors können Zugriff auf dieses Script erhalten. Sie müssen diese Genehmigung bei dem Autor beantragen. Dies umfasst üblicherweise auch eine Zahlung. Wenn Sie mehr erfahren möchten, dann sehen Sie sich unten die Anweisungen des Autors an oder kontaktieren Sie timwest direkt.
TradingView empfiehlt NICHT, für die Nutzung eines Scripts zu bezahlen, wenn Sie den Autor nicht als vertrauenswürdig halten und verstehen, wie das Script funktioniert. Sie können außerdem auch kostenlose Open-Source-Alternativen in unseren Community-Scripts finden.