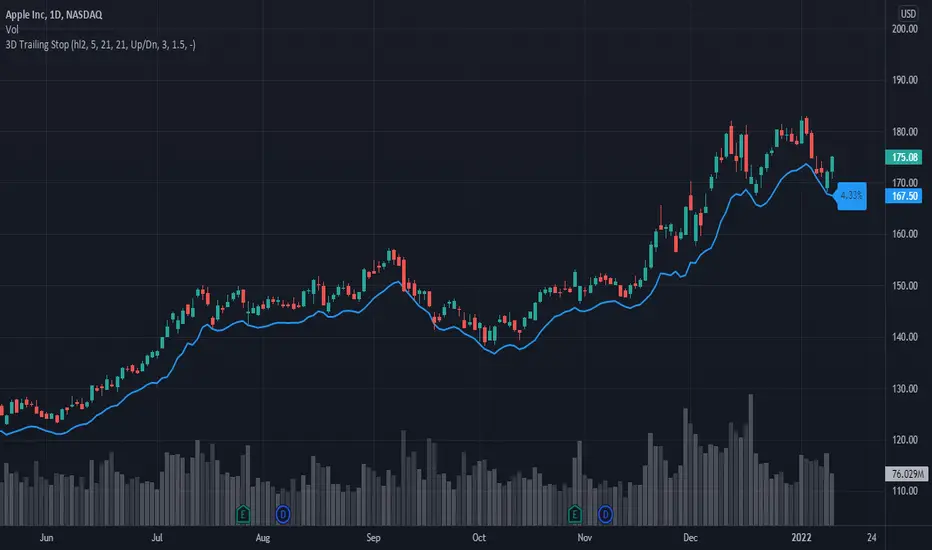
3D Trailing Stop

For example when looking at a long-only trade, the more up days and the more volume on those up days, the wider the trailing stop will be. However when the trend changes, and there's more down days with more volume then the trailing stop will tighten. The idea is to try and keep us in good trends for longer and get out of reversing trends earlier.
The default distance the trailing stop will be from the EMA (5) is always a multiple of 1.5 - 3x the ATR (21) and all of these settings are changeable by the user. To change the trailing stop from the default long trend to short trend change the ATR Offset setting from - to +. If you wish to display both a long and short trailing stop, simply add the indicator again to your chart with the ATR Offset + setting enabled. The indicator also shows how far the trailing stop price is from the last price, expressed as a % on the chart so you can easily see how far away the trailing stop is.
There are a few ways it can be used, for example one may wish to enter on a 50 or 100 bar high/low breakout and use the 3D Trailing Stop as a indicator when to get out of the trade. You could exit once price goes below the trailing stop, or use the previous bar trailing stop value as the level for a quicker exit.
This indicator can be used on any market and any timeframe, for both long and short trades. We have found it to work best on stocks long-only using the daily timeframe as stocks tend to have good up-trends over time. You could also use it on smaller timeframes in conjunction with other indicators and signals to enhance your win rate.
To get access PM or email me to my address shown below.
Enjoy :)
Disclaimer: All my scripts and content are for educational purposes only. I'm not a financial advisor and do not give personal finance advice. Past performance is no guarantee of future performance. Please trade at your own risk.
Skript nur auf Einladung
Ausschließlich Nutzer mit einer Erlaubnis des Autors können Zugriff auf dieses Script erhalten. Sie müssen diese Genehmigung bei dem Autor beantragen. Dies umfasst üblicherweise auch eine Zahlung. Wenn Sie mehr erfahren möchten, dann sehen Sie sich unten die Anweisungen des Autors an oder kontaktieren Sie Click-Capital direkt.
TradingView empfiehlt NICHT, für die Nutzung eines Scripts zu bezahlen, wenn Sie den Autor nicht als vertrauenswürdig halten und verstehen, wie das Script funktioniert. Sie können außerdem auch kostenlose Open-Source-Alternativen in unseren Community-Scripts finden.
Hinweise des Autors
Haftungsausschluss
Skript nur auf Einladung
Ausschließlich Nutzer mit einer Erlaubnis des Autors können Zugriff auf dieses Script erhalten. Sie müssen diese Genehmigung bei dem Autor beantragen. Dies umfasst üblicherweise auch eine Zahlung. Wenn Sie mehr erfahren möchten, dann sehen Sie sich unten die Anweisungen des Autors an oder kontaktieren Sie Click-Capital direkt.
TradingView empfiehlt NICHT, für die Nutzung eines Scripts zu bezahlen, wenn Sie den Autor nicht als vertrauenswürdig halten und verstehen, wie das Script funktioniert. Sie können außerdem auch kostenlose Open-Source-Alternativen in unseren Community-Scripts finden.