PROTECTED SOURCE SCRIPT
Aktualisiert Thiru Macro Time Cycles

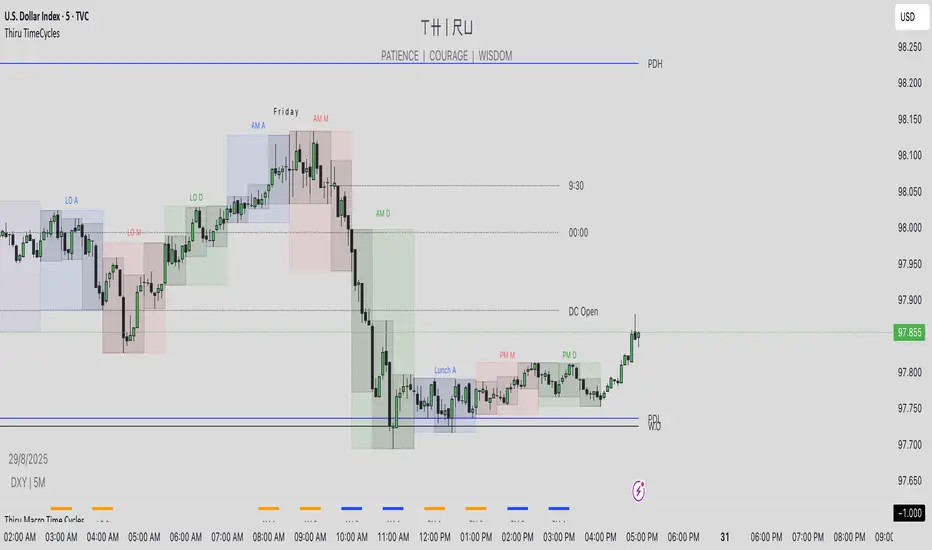
Macro Time Cycles
This indicator plots horizontal lines in a separate pane to highlight key macro timeline windows based on Eastern Time (EST), aiding traders in identifying significant market periods. It includes customizable London and New York trading sessions with adjustable line colors and label visibility.
Key Features:
Displays macro timelines for London (2:45–3:15 AM, 3:45–4:15 AM) and New York AM/PM sessions (7:45–8:15 AM, 8:45–9:15 AM, 9:45–10:15 AM, 10:45–11:15 AM, 11:45 AM–12:15 PM, 12:45–1:15 PM, 1:45–2:15 PM, 2:45–3:15 PM).
Lines are drawn with a fixed width of 3 and can be colored via user inputs.
Labels (e.g., "LO 1", "AM 1") are placed at the bottom of the pane, with options to hide or show them.
Adjustable label alignment (Left, Center, Right) for better chart organization.
Uses a separate pane (overlay = false) to avoid cluttering the price chart.
How to Use:
Add the indicator to your chart via the TradingView interface.
Customize line colors for each macro timeline in the indicator settings.
Toggle "Show Labels" on or off to display or hide labels at the bottom of the pane.
Adjust the "Text Alignment" setting to position labels as preferred.
The indicator automatically adjusts to the chart’s timeframe, ensuring accurate session boundaries.
Notes:
Timezone is fixed to Eastern Time (EST).
Ensure your chart timeframe aligns with the 30-minute macro windows for optimal visibility.
Perfect for traders focusing on London and New York session analysis.
Versionshinweise
adjusted some lines of code it will show the macro time when its startsVersionshinweise
The "Macro Time Cycles" indicator is designed to highlight key market session windows on your chart, focusing on London and New York trading hours. It draws horizontal lines and labels for predefined macro time cycles (e.g., 2:45–3:15 AM, 7:45–8:15 AM EST), helping traders identify potential high-activity periods. By default, it displays the past 7 days (Monday to Friday), with customizable options to adjust the lookback period.Key Features:
Customizable Time Cycles: Marks London (LO) and New York AM/PM (NYAM/NYPM) sessions with precise start and end times in Eastern Time (EST).
7-Day Default View: Displays macro cycles for the past week (e.g., August 25–30, 2025, as of today), retaining previous days' data.
Adjustable Lookback: Users can modify the "Days to Show" input (minimum 1 day) to focus on a specific period.
Label Options: Toggle labels on/off and align them (Left, Center, Right) for better chart readability.
Color Customization: Assign unique colors to each session for easy identification.
Timeframe Compatibility: Works across 1-minute, 5-minute, and other timeframes with accurate line placement.
Usage Instructions:
Add the indicator to your chart from the TradingView Indicators menu.
Adjust the "Days to Show" input to set the lookback period (default is 7 days).
Customize colors for each session under the "Colors" group.
Enable/disable labels and choose their alignment via the "Label Settings" group.
Ensure your chart range includes the desired past days (e.g., August 25–30, 2025) to view all cycles.
Notes:
Lines represent session start (e.g., 2:45 AM) to end (e.g., 3:15 AM) times in EST.
As of 02:09 PM IST (04:39 AM EST) on August 30, 2025, the indicator will show cycles from August 25 onward, based on the chart's visible range.
Compatible with any instrument; best used on forex or indices with overlapping session activity.
Author: Thirupathi R//
Version: 1.0
Published: August 30, 2025
Geschütztes Skript
Dieses Script ist als Closed-Source veröffentlicht. Sie können es kostenlos und ohne Einschränkungen verwenden – erfahren Sie hier mehr.
Haftungsausschluss
Die Informationen und Veröffentlichungen sind nicht als Finanz-, Anlage-, Handels- oder andere Arten von Ratschlägen oder Empfehlungen gedacht, die von TradingView bereitgestellt oder gebilligt werden, und stellen diese nicht dar. Lesen Sie mehr in den Nutzungsbedingungen.