PROTECTED SOURCE SCRIPT
AEON | Liquidity Hunter
A visual tool for identifying high-probability liquidity zones across multiple timeframes and sessions.
Overview
Liquidity Hunter is a multi-timeframe, all market tool designed to help traders visualise areas where price may be drawn in search of resting liquidity. These liquidity zones often align with swing highs and lows, session extremes, or significant higher-time-frame reference points.
Rather than producing entry or exit signals, this indicator aims to support market behaviour analysis and contextual awareness.
Core Functions
The indicator identifies potential liquidity areas using four optional methods:
1. Current Time Frame Analysis – Automatically locates swing highs and lows based on a customisable setting for sensitivity and lookback depth.
2. Higher Time Frame Analysis – Uses the same logic as above, but projects liquidity zones from a selected higher time frame (HTF).
3. Session Highs & Lows – Highlights the Asian, London, New York, or user-defined session extremes where liquidity commonly pools.
4. Time-Based Highs & Lows – Marks the final bar of any higher time frame (for example, the last H4 or D1 candle) to show potential liquidity reference points.
Each method can be enabled or disabled independently and visually customised, allowing traders to tailor the display to their preferred style and time frame.
How to Use
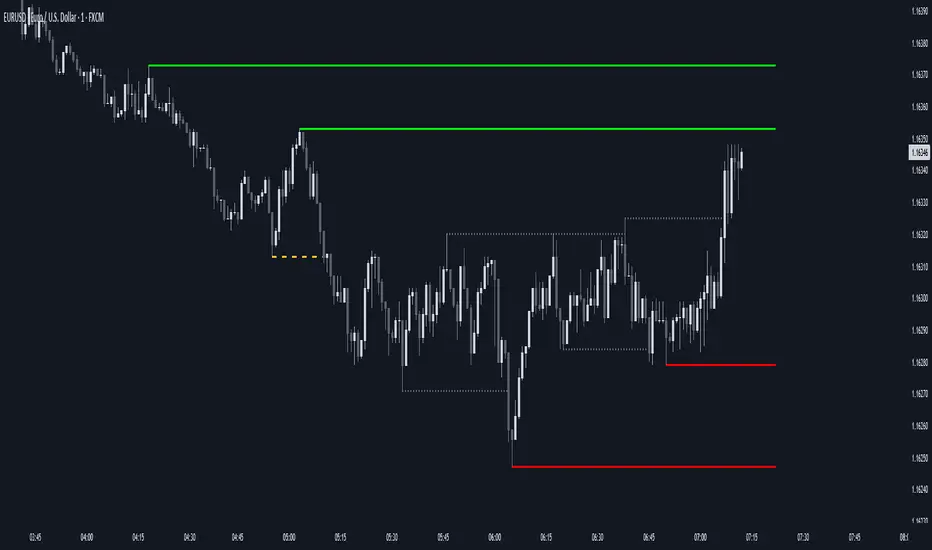
When applied, the indicator plots horizontal levels representing potential liquidity pools. These levels persist until price engages with or mitigates them, at which point users can opt to modify their visual style or delete them as preferred.
Adjusting the sensitivity of the current and higher time frame levels may reflect the market's likelihood of treating them as targets or reversal points.
Many traders combine these levels with concepts such as market structure shifts, displacement, or fair-value gaps to build a narrative around price behaviour.
Disclaimer
This indicator is provided for educational and informational purposes only. It does not constitute financial advice or a trade signal. Past performance or visual confluence does not guarantee future results.
---
About the Author
Created by a passionate developer focused on algorithmic and quantitative concepts.
Overview
Liquidity Hunter is a multi-timeframe, all market tool designed to help traders visualise areas where price may be drawn in search of resting liquidity. These liquidity zones often align with swing highs and lows, session extremes, or significant higher-time-frame reference points.
Rather than producing entry or exit signals, this indicator aims to support market behaviour analysis and contextual awareness.
Core Functions
The indicator identifies potential liquidity areas using four optional methods:
1. Current Time Frame Analysis – Automatically locates swing highs and lows based on a customisable setting for sensitivity and lookback depth.
2. Higher Time Frame Analysis – Uses the same logic as above, but projects liquidity zones from a selected higher time frame (HTF).
3. Session Highs & Lows – Highlights the Asian, London, New York, or user-defined session extremes where liquidity commonly pools.
4. Time-Based Highs & Lows – Marks the final bar of any higher time frame (for example, the last H4 or D1 candle) to show potential liquidity reference points.
Each method can be enabled or disabled independently and visually customised, allowing traders to tailor the display to their preferred style and time frame.
How to Use
When applied, the indicator plots horizontal levels representing potential liquidity pools. These levels persist until price engages with or mitigates them, at which point users can opt to modify their visual style or delete them as preferred.
Adjusting the sensitivity of the current and higher time frame levels may reflect the market's likelihood of treating them as targets or reversal points.
Many traders combine these levels with concepts such as market structure shifts, displacement, or fair-value gaps to build a narrative around price behaviour.
Disclaimer
This indicator is provided for educational and informational purposes only. It does not constitute financial advice or a trade signal. Past performance or visual confluence does not guarantee future results.
---
About the Author
Created by a passionate developer focused on algorithmic and quantitative concepts.
Geschütztes Skript
Dieses Script ist als Closed-Source veröffentlicht. Sie können es kostenlos und ohne Einschränkungen verwenden – erfahren Sie hier mehr.
Haftungsausschluss
Die Informationen und Veröffentlichungen sind nicht als Finanz-, Anlage-, Handels- oder andere Arten von Ratschlägen oder Empfehlungen gedacht, die von TradingView bereitgestellt oder gebilligt werden, und stellen diese nicht dar. Lesen Sie mehr in den Nutzungsbedingungen.