The 11 moving averages with bar color
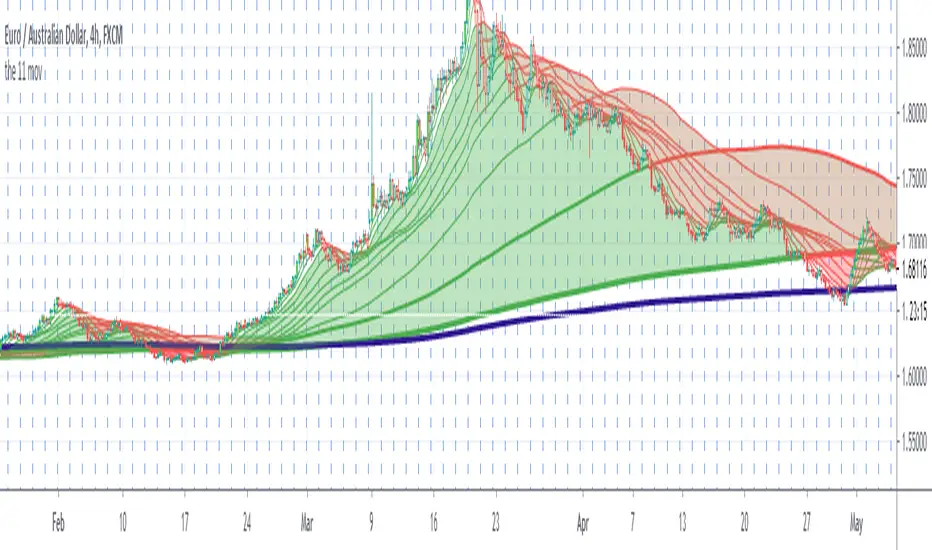
The moving averages change color becoming green or red if there is a bullish trend in green or a bearish trend in red.
There are few ways to use this indicator.These two is what I found easier, please back test it and share your thoughts.
1. When the cloud is red and the candle is outside the cloud and the candle become red it s a sell entry.
When the cloud is green and the candle is outside the cloud and become green it s a buy entry.
2.The moving averages can be used as dynamic support and resistance.In a red cloud if a candle stop exactly where there is a moving averages and the next candle is a bearish engulfing candle it s a sell entry.
In a green cloud if a candle stop exactly where there is a moving averages and the next candle is a bullish engulfing candle it s a buy entry.
The exit is when the bar is not colored anymore or if the bar close below/above the second moving average from the top/from the bottom
Please look as well the blue moving averages that could work as dynamic support/resistance
VERY IMPORTANT WHEN YOU TRY A NEW STRATEGY TEST IT IN A DEMO ACCOUNT FOR AT LEAST 3 MONTHS
Every donations will be devolved to cancer research and you ll have one month free trial.
If you want to purchase this indicator 30% will be devolved to cancer research.
Please leave a comment or message me if you want you have two weeks trial.
Enjoy!
Skript nur auf Einladung
Ausschließlich Nutzer mit einer Erlaubnis des Autors können Zugriff auf dieses Script erhalten. Sie müssen diese Genehmigung bei dem Autor beantragen. Dies umfasst üblicherweise auch eine Zahlung. Wenn Sie mehr erfahren möchten, dann sehen Sie sich unten die Anweisungen des Autors an oder kontaktieren Sie Itakepips direkt.
TradingView empfiehlt NICHT, für die Nutzung eines Scripts zu bezahlen, wenn Sie den Autor nicht als vertrauenswürdig halten und verstehen, wie das Script funktioniert. Sie können außerdem auch kostenlose Open-Source-Alternativen in unseren Community-Scripts finden.
Hinweise des Autors
As well you can have access in our website itakepips.com/
youtube.com/channel/UCupP8hWmM9dIZAXtc_ZVCOg
Haftungsausschluss
Skript nur auf Einladung
Ausschließlich Nutzer mit einer Erlaubnis des Autors können Zugriff auf dieses Script erhalten. Sie müssen diese Genehmigung bei dem Autor beantragen. Dies umfasst üblicherweise auch eine Zahlung. Wenn Sie mehr erfahren möchten, dann sehen Sie sich unten die Anweisungen des Autors an oder kontaktieren Sie Itakepips direkt.
TradingView empfiehlt NICHT, für die Nutzung eines Scripts zu bezahlen, wenn Sie den Autor nicht als vertrauenswürdig halten und verstehen, wie das Script funktioniert. Sie können außerdem auch kostenlose Open-Source-Alternativen in unseren Community-Scripts finden.
Hinweise des Autors
As well you can have access in our website itakepips.com/
youtube.com/channel/UCupP8hWmM9dIZAXtc_ZVCOg