PROTECTED SOURCE SCRIPT
Aktualisiert Precision Candles
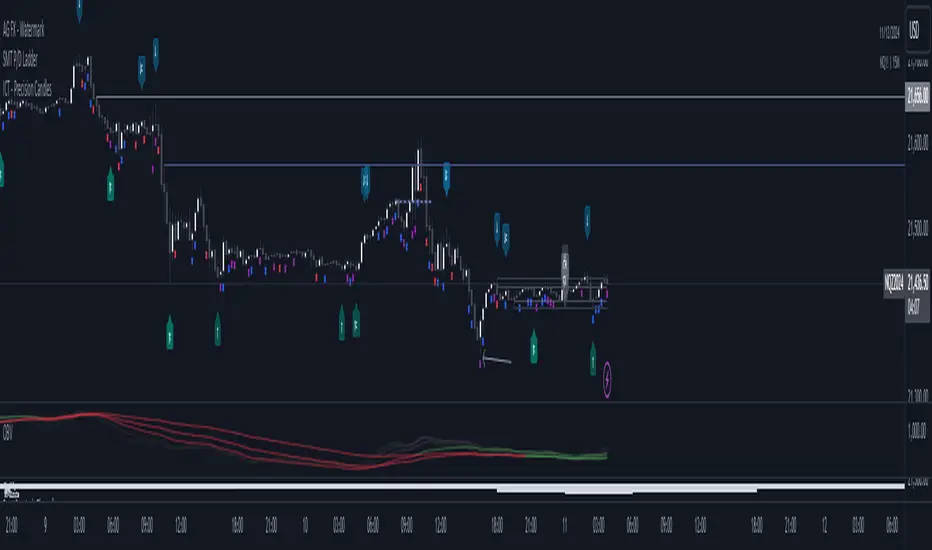
This Pine Script is designed to help you uncover hidden divergences among multiple assets by tracking how their candles close. Imagine you're analyzing three different assets — they could be indices, currencies, or even cryptocurrencies — and you want to know when one of them is moving out of sync with the others. That’s where this script comes into play.
First, it gives you the flexibility to choose custom ticker symbols or rely on predefined ones based on different asset classes like metals, bonds, or altcoins. Once the symbols are set, the script continuously monitors the opening, high, low, and closing prices of each asset.
The magic happens when it determines the nature of each candle: is it bullish or bearish? By comparing these closing behaviors, the script checks for any discrepancies — situations where at least one asset diverges from the trend of the others. When this happens, the script plots a red "PC" marker below the bar on your chart, drawing your attention to these moments of divergence.
This tool can be invaluable for traders looking to spot unique market dynamics, identify potential trading opportunities, or simply get insights into how different assets behave in relation to each other. It's a simple but powerful way to keep an eye on correlations and anticipate shifts in market sentiment.
Versionshinweise
This Pine Script is designed to help you uncover hidden divergences among multiple assets by tracking how their candles close. Imagine you're analyzing three different assets — they could be indices, currencies, or even cryptocurrencies — and you want to know when one of them is moving out of sync with the others. That’s where this script comes into play.First, it gives you the flexibility to choose custom ticker symbols or rely on predefined ones based on different asset classes like metals, bonds, or altcoins. Once the symbols are set, the script continuously monitors the opening, high, low, and closing prices of each asset.
The magic happens when it determines the nature of each candle: is it bullish or bearish? By comparing these closing behaviors, the script checks for any discrepancies — situations where at least one asset diverges from the trend of the others. When this happens, the script plots a red "PC" marker below the bar on your chart, drawing your attention to these moments of divergence.
This tool can be invaluable for traders looking to spot unique market dynamics, identify potential trading opportunities, or simply get insights into how different assets behave in relation to each other. It's a simple but powerful way to keep an eye on correlations and anticipate shifts in market sentiment.
Versionshinweise
Deleted the TextVersionshinweise
Now with Timezone filters and Layered PCVersionshinweise
Fond Size changeVersionshinweise
FondVersionshinweise
Lot of changesVersionshinweise
Updated to Version 6Bug Fixes for some colours
added all the Micros aswell
Geschütztes Skript
Dieses Script ist als Closed-Source veröffentlicht. Sie können es kostenlos und ohne Einschränkungen verwenden – erfahren Sie hier mehr.
Haftungsausschluss
Die Informationen und Veröffentlichungen sind nicht als Finanz-, Anlage-, Handels- oder andere Arten von Ratschlägen oder Empfehlungen gedacht, die von TradingView bereitgestellt oder gebilligt werden, und stellen diese nicht dar. Lesen Sie mehr in den Nutzungsbedingungen.