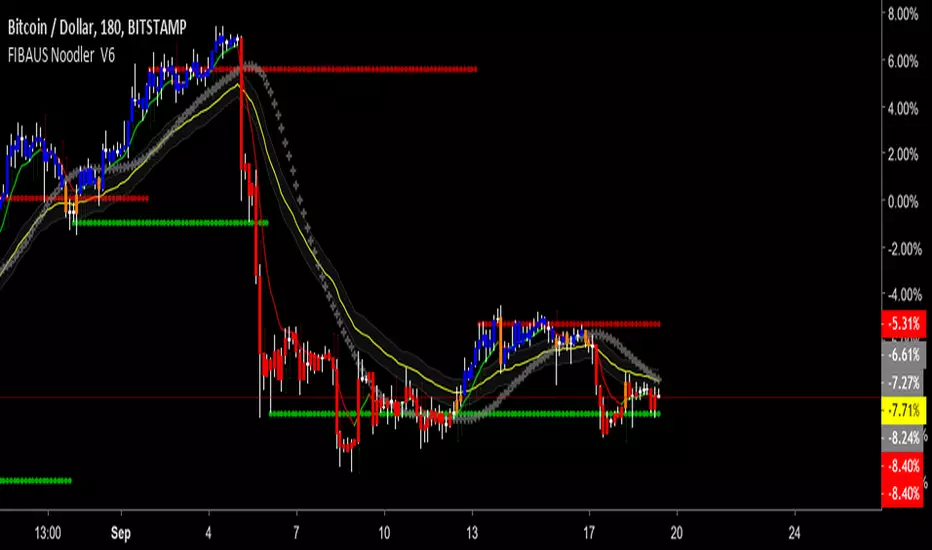
FIBAUS Noodler V6

FEATURES
1.RESISTANCE AND SUPPORT - Finds Hidden and Fibonacci based R&S Levels, to assist with buying and selling targets.
2.SENTIMENT INDICATOR-A measure of human confidence and fear as it relates to price.
3.BANKERS GOLDEN NOODLE - A very specific institutional (banks, investment firms etc) calculation.
4.COLORED BARS - To show uptrend, uncertainty and downtrend.
Blue - Up-Trend/Breakout -(BUY/LONG)
Orange - Potential Trend reversal
Red - Downtrend (SELL/SHORT)
5.ALL markets anytime timeframe-(stocks, crypto, forex, futures ) application
FOR TRIAL ACCESS - 1. Follow me, 2. Like the script 3. Message me the words “I WANT IN NOW”.
BUY SIGNALS - 1.When Rapid Price Direction line crosses up the Sentiment Indicator
2.When Rapid Price Direction line crosses up the Bankers Golden Noodle
3. Candles Turn From Orange to Blue
SELL SIGNALS - 1.When Rapid Price Direction line crosses down the Sentiment Indicator
2.When Rapid Price Direction line crosses down the Bankers Golden
Noodle.
3. Candles Turn From Orange to RED
PRO Tips: 1. Remove candle borders for better visual of colored candles.
2. Make the Sentiment Line Transparent for less color on the chart
(Step 1:Double click on the script after applied to chart)
(Step 2:Click Inputs at the top of the menu and check the Color box)
3. Two more PRO BUY and SELL Techniques for free private chat members only.
FOR TRIAL ACCESS - 1. Follow me, 2. Like the script 3. Message me the words “I WANT IN NOW”
Happy Trading,
FIBAUS
Skript nur auf Einladung
Ausschließlich Nutzer mit einer Erlaubnis des Autors können Zugriff auf dieses Script erhalten. Sie müssen diese Genehmigung bei dem Autor beantragen. Dies umfasst üblicherweise auch eine Zahlung. Wenn Sie mehr erfahren möchten, dann sehen Sie sich unten die Anweisungen des Autors an oder kontaktieren Sie fibonacciaustrian direkt.
TradingView empfiehlt NICHT, für die Nutzung eines Scripts zu bezahlen, wenn Sie den Autor nicht als vertrauenswürdig halten und verstehen, wie das Script funktioniert. Sie können außerdem auch kostenlose Open-Source-Alternativen in unseren Community-Scripts finden.
Hinweise des Autors
Haftungsausschluss
Skript nur auf Einladung
Ausschließlich Nutzer mit einer Erlaubnis des Autors können Zugriff auf dieses Script erhalten. Sie müssen diese Genehmigung bei dem Autor beantragen. Dies umfasst üblicherweise auch eine Zahlung. Wenn Sie mehr erfahren möchten, dann sehen Sie sich unten die Anweisungen des Autors an oder kontaktieren Sie fibonacciaustrian direkt.
TradingView empfiehlt NICHT, für die Nutzung eines Scripts zu bezahlen, wenn Sie den Autor nicht als vertrauenswürdig halten und verstehen, wie das Script funktioniert. Sie können außerdem auch kostenlose Open-Source-Alternativen in unseren Community-Scripts finden.