umr Level Tree
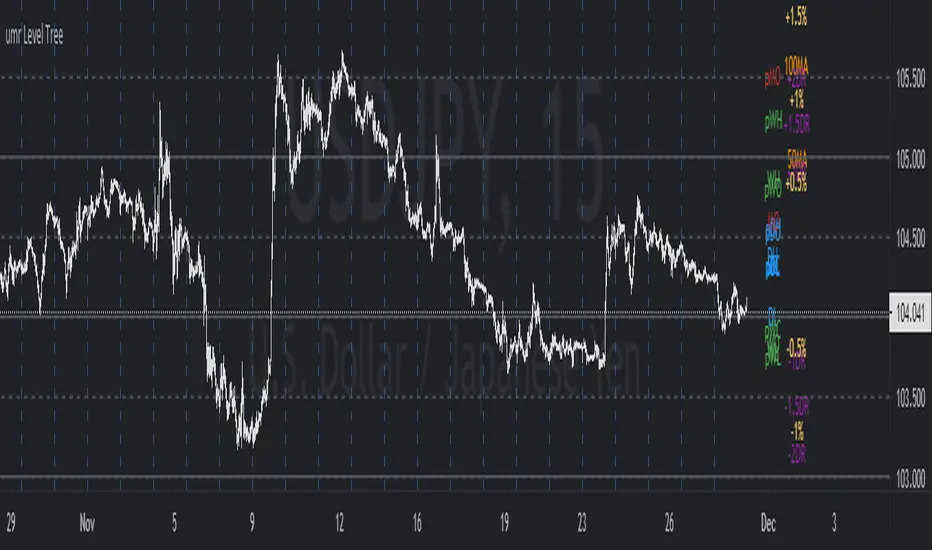
- OHLC levels of Today, Yesterday, This week, Last week, This Month, Last Month
- Daily Simple Moving Averages (50, 100, 200)
- Horizontal Grid on 50, 100 pips for FX instruments.
- (to do) Add ATR or Std Deviation
- (to do) Add Daily Change levels % i.e. 0.5%, 1%, 2%
- (to do) Add Daily change in pips levels (for fx) i.e. 50 pips, 100 pips etc
reduced monthly levels to only 'open'
Colors for grid and labels can be manually selected now.
Label colors now match line colors.
And all colors can be customized in the settings.
Quick Guide:
- First column shows: Current Timeframes (today, this week, this month)
- Second Column Shows: Last Timeframes (yesterday,. last week, last month)
- Third Column shows: Daily averages (and soon will show other info like % moves on the day)
Label Codes:
In the first two columns:
First letter shows the timeframe i.e. Day, Week, Month
Second Letter shows the type OHLC i.e Open High Low Close
So DO means Day Open, WH means Weekly High
Daily Range Levels Have been Added.
By default, only Labels are shown.
Levels which are available are:
+- 1x ADR
+- 1.5 ADR
+- 2 ADR
+- 2.5 ADR
+- 3 ADR
* Master Switches that control all Lines and Labels have been added.
So it is now very easy to select the kind of levels and labels you want to see at once.
And then turn them on/off with a single selection. No need to go and check/uncheck multiple things.
* Current Timeframe and Last Timeframe has same colours by default.
* Grid levels by default are set to 10
* 2.5 Daily ATR level has been added.
Now there are only 2 columns.
First one for HTF Levels.
Second one for other reference info like ATR, Moving Averages etc.
% move from Day open is also in there.
But had to take some levels off to not go over TV's pinescript limits.
In future, I will be splitting the indi in to 2.
1 for each column and type of info,
that will allow us to cram in more level and that will give us higher coverage %, ATR levels etc.
Bugs Fixed:
* Line and Labels of Averages are now being controlled by Master switches as well.
* % lines and labels are now correctly controlled by their own switches and not through ADR switches.
Daily Range (ATR) period can now be manually selected.
Previously it was set to 15, but now you can change it to 20 or anything you want.
- Grid has been fixed and simplified. 10 pip grid removed and now only 50/100 pip remains.
- All previous HTF Levels are now identified with a single letter p in front of their name instead of [1] after. We save 2 letters this way :)
Scale = Scale.none added.
But make sure to select "Scale Price Chart Only" option by right clicking the price axis if charts get pinched when you apply the indi.
something very screwy going on with the script.
hhopefully,this update should fix it.
MAJOR BUG FIXED.
Delete and Re-apply!
Skript nur auf Einladung
Ausschließlich Nutzer mit einer Erlaubnis des Autors können Zugriff auf dieses Script erhalten. Sie müssen diese Genehmigung bei dem Autor beantragen. Dies umfasst üblicherweise auch eine Zahlung. Wenn Sie mehr erfahren möchten, dann sehen Sie sich unten die Anweisungen des Autors an oder kontaktieren Sie trader_umr direkt.
TradingView empfiehlt NICHT, für die Nutzung eines Scripts zu bezahlen, wenn Sie den Autor nicht als vertrauenswürdig halten und verstehen, wie das Script funktioniert. Sie können außerdem auch kostenlose Open-Source-Alternativen in unseren Community-Scripts finden.
Hinweise des Autors
Haftungsausschluss
Skript nur auf Einladung
Ausschließlich Nutzer mit einer Erlaubnis des Autors können Zugriff auf dieses Script erhalten. Sie müssen diese Genehmigung bei dem Autor beantragen. Dies umfasst üblicherweise auch eine Zahlung. Wenn Sie mehr erfahren möchten, dann sehen Sie sich unten die Anweisungen des Autors an oder kontaktieren Sie trader_umr direkt.
TradingView empfiehlt NICHT, für die Nutzung eines Scripts zu bezahlen, wenn Sie den Autor nicht als vertrauenswürdig halten und verstehen, wie das Script funktioniert. Sie können außerdem auch kostenlose Open-Source-Alternativen in unseren Community-Scripts finden.