PROTECTED SOURCE SCRIPT
Aktualisiert Thunderbird Volcano & Waterfall Signals
The Thunderbird Volcano & Waterfall signal Indicator is a strategy that incorporates the use of Price Action and TRAMA positioning to determine entry and exit points. There are 3 scenarios in which the indicator will signal an entry and exit if applicable. Keep in mind the suggested entry and exit points must be taken as consideration; further confirmations such as TRAMA pointing down or up, market structure, IFVG, etc. should be used in order for a successful trade.
Scenario 1 (SHORT) is the Thunderbird Volcano setup, TRAMA alignment is in accordance with the Volcano setup; A red arrow above will indicate entry when a candle closes below the 20T and a red cross will indicate the potential target at the 200T.
Scenario 2 (SHORT) is the Thunderbird Waterfall setup, TRAMA alignment is in accordance with the Waterfall setup; A blue arrow above will indicate entry when a candle closes below all 3 TRAMAs after corresponding position is established. Target is not indicated and can vary according to user specification.
Scenario 3 (LONG) is the Inverse Volcano setup, TRAMA alignment is in accordance with the Inverse Volcano setup. A green arrow will indicate entry below when a candle closes above the 20T and a green cross will indicate the potential target at the 200T.
Versionshinweise
The Thunderbird Volcano & Waterfall signal Indicator is a strategy that incorporates the use of Price Action and TRAMA positioning to determine entry and exit points. There are 3 scenarios in which the indicator will signal an entry and exit if applicable. Keep in mind the suggested entry and exit points must be taken as consideration; further confirmations such as TRAMA pointing down or up, market structure, IFVG, etc. should be used in order for a successful trade.Scenario 1 (SHORT) is the Thunderbird Volcano setup, TRAMA alignment is in accordance with the Volcano setup; A red arrow above will indicate entry when a candle closes below the 20T and a red cross will indicate the potential target at the 200T.
Scenario 2 (SHORT) is the Thunderbird Waterfall setup, TRAMA alignment is in accordance with the Waterfall setup; A blue arrow above will indicate entry when a candle closes below all 3 TRAMAs after corresponding position is established. Target is not indicated and can vary according to user specification.
Scenario 3 (LONG) is the Thunderbird Inverse Volcano setup, TRAMA alignment is in accordance with the Inverse Volcano setup. A green arrow will indicate entry below when a candle closes above the 20T and a green cross will indicate the potential target at the 200T.
Versionshinweise
The Thunderbird Volcano & Waterfall signal Indicator is a strategy that incorporates the use of Price Action and TRAMA positioning to determine entry and exit points. There are 3 scenarios in which the indicator will signal an entry and exit if applicable. Keep in mind the suggested entry and exit points must be taken as consideration; further confirmations such as TRAMA pointing down or up, market structure, IFVG, etc. should be used in order for a successful trade.Scenario 1 (SHORT) is the Thunderbird Volcano setup, TRAMA alignment is in accordance with the Volcano setup; A red arrow above will indicate entry when a candle closes below the 20T and a red cross will indicate the potential target at the 200T.
Scenario 2 (SHORT) is the Thunderbird Waterfall setup, TRAMA alignment is in accordance with the Waterfall setup; A blue arrow above will indicate entry when a candle closes below all 3 TRAMAs after corresponding position is established. Target is not indicated and can vary according to user specification.
Scenario 3 (LONG) is the Inverse Volcano setup, TRAMA alignment is in accordance with the Inverse Volcano setup. A green arrow will indicate entry below when a candle closes above the 20T and a green cross will indicate the potential target at the 200T.
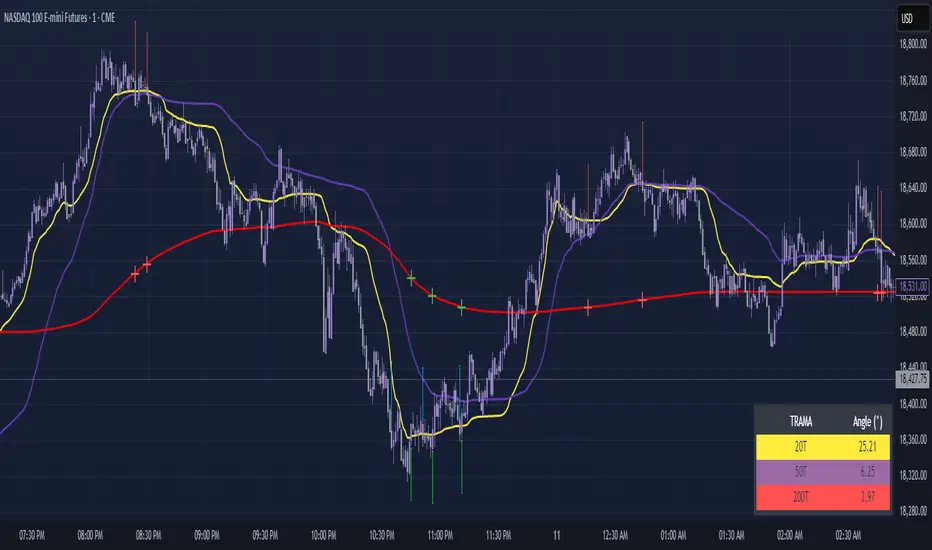
V2 Update:
-Includes TRAMA angle table in degrees to monitor current TRAMA angle for confirmed trend.
-User adjustable settings to show/hide selected scenarios on the chart.
Versionshinweise
The Thunderbird Volcano & Waterfall signal Indicator is a strategy that incorporates the use of Price Action and TRAMA positioning to determine entry and exit points. There are 3 scenarios in which the indicator will signal an entry and exit if applicable. Keep in mind the suggested entry and exit points must be taken as consideration; further confirmations such as TRAMA pointing down or up, market structure, IFVG, etc. should be used in order for a successful trade.Scenario 1 (SHORT) is the Thunderbird Volcano setup, TRAMA alignment is in accordance with the Volcano setup; A red arrow above will indicate entry when a candle closes below the 20T and a red cross will indicate the potential target at the 200T.
Scenario 2 (SHORT) is the Thunderbird Waterfall setup, TRAMA alignment is in accordance with the Waterfall setup; A blue arrow above will indicate entry when a candle closes below all 3 TRAMAs after corresponding position is established. Target is not indicated and can vary according to user specification.
Scenario 3 (LONG) is the Inverse Volcano setup, TRAMA alignment is in accordance with the Inverse Volcano setup. A green arrow will indicate entry below when a candle closes above the 20T and a green cross will indicate the potential target at the 200T.
V2 Update:
-Includes TRAMA angle table in degrees to monitor current TRAMA angle for confirmed trend.
-User adjustable settings to show/hide selected scenarios on the chart.
Versionshinweise
Updated script for arrow placements.Geschütztes Skript
Dieses Script ist als Closed-Source veröffentlicht. Sie können es kostenlos und ohne Einschränkungen verwenden – erfahren Sie hier mehr.
Haftungsausschluss
Die Informationen und Veröffentlichungen sind nicht als Finanz-, Anlage-, Handels- oder andere Arten von Ratschlägen oder Empfehlungen gedacht, die von TradingView bereitgestellt oder gebilligt werden, und stellen diese nicht dar. Lesen Sie mehr in den Nutzungsbedingungen.
Geschütztes Skript
Dieses Script ist als Closed-Source veröffentlicht. Sie können es kostenlos und ohne Einschränkungen verwenden – erfahren Sie hier mehr.
Haftungsausschluss
Die Informationen und Veröffentlichungen sind nicht als Finanz-, Anlage-, Handels- oder andere Arten von Ratschlägen oder Empfehlungen gedacht, die von TradingView bereitgestellt oder gebilligt werden, und stellen diese nicht dar. Lesen Sie mehr in den Nutzungsbedingungen.