PROTECTED SOURCE SCRIPT
Aktualisiert Auto Fibonacci Retracament Levels by evhar002

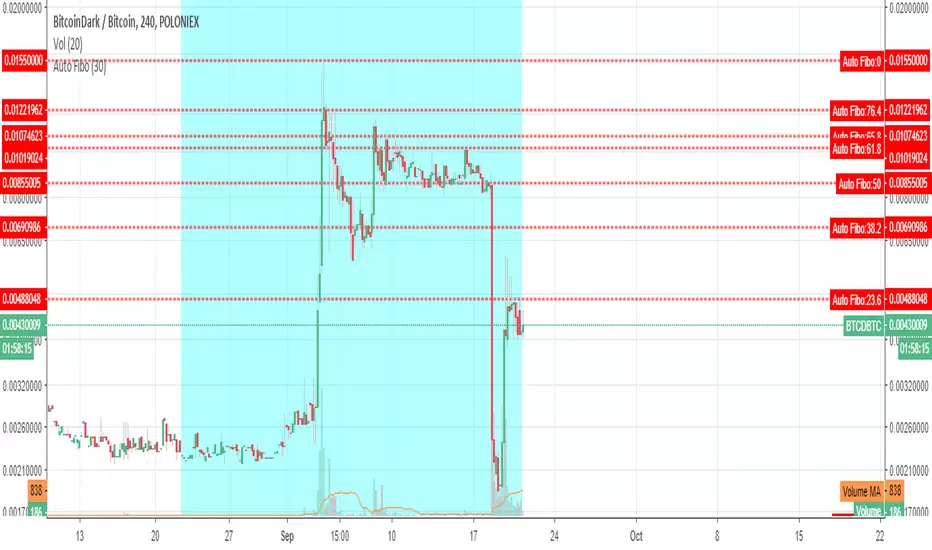
This indicator/tool (Auto Fibo) draws Fibonacci Retracement Levels automatically on chart.
The algorithm of the Indicator Plots the extreme points and puts the retracement levels in order by itself with 100% sensitivity.
The key point is that to arrange the length of the "Days Back" to arrange the correct extreme points.
Like the other auto plotting tools, the levels can change when the time frame of the chart changes, in contrast with manually drawn Fibo levels.
In technical analysis , a Fibonacci retracement is created by taking two extreme points (usually a major peak and trough) on a stock chart and dividing the vertical distance by the key Fibonacci ratios of 23.6%, 38.2%, 50%, 61.8% and 100%.
Description copied from tr.tradingview.com/u/KIVANCfr3762 and updated according to this script content.
Here's the link to a complete list of all my published indicators:
tradingview.com/u/evhar002/
Versionshinweise
Day parameter default and max values updated. (Default value 10 days, max value 360 days)Versionshinweise
0 and 100 plot label's updated according to starting of fibo. Fibonacci starting point is 100%, end point is 0%.Versionshinweise
New retracament levels add as optional. -23.6
-38.2
-61.8
-65.8
Geschütztes Skript
Dieses Script ist als Closed-Source veröffentlicht. Sie können es kostenlos und ohne Einschränkungen verwenden – erfahren Sie hier mehr.
Haftungsausschluss
Die Informationen und Veröffentlichungen sind nicht als Finanz-, Anlage-, Handels- oder andere Arten von Ratschlägen oder Empfehlungen gedacht, die von TradingView bereitgestellt oder gebilligt werden, und stellen diese nicht dar. Lesen Sie mehr in den Nutzungsbedingungen.