OPEN-SOURCE SCRIPT
Aktualisiert Relative Strength of 2 securities - Jayy

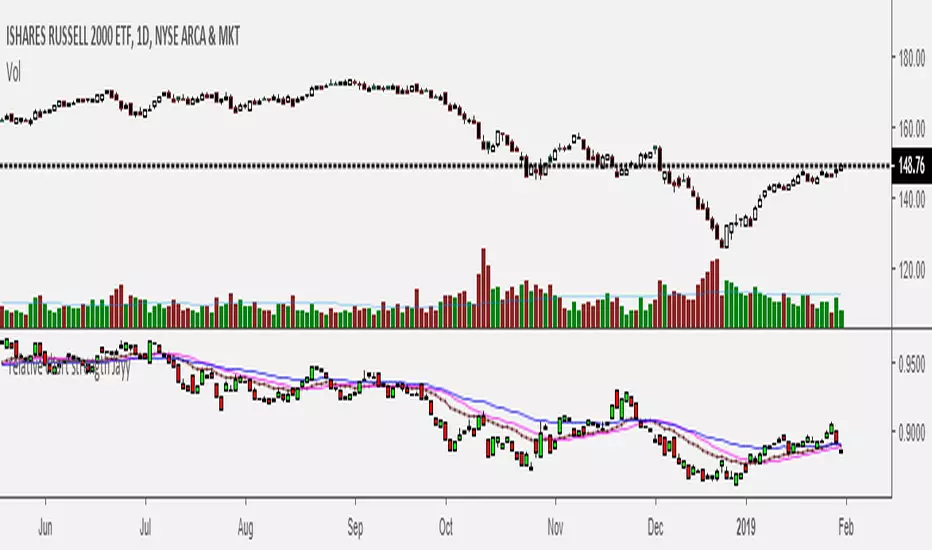
This is an update of the Relative Strength to index as used by Leaf_West.. 4th from the top. my original RS script is 3rd from the top.
In this use of the term " Relative Strength" (RS) what is meant is a ratio of one security to another.
The RS can be inerpreted in a fashion similar to price action on a regual security chart.
If you follow his methods be aware of the different moving averages for the different time periods.
From Leaf_West: "on my weekly and monthly R/S charts, I include a 13 EMA of the R/S (brown dash line) and
an 8 SMA of the 13 EMA (pink solid line). The indicator on the bottom of the weekly/monthly charts is an
8 period momentum indicator of the R/S line. The red horizontal line is drawn at the zero line.
For daily or 130-minute time periods (or shorter), my R/S charts are slightly different
- the moving averages of the R/S line include a 20EMA (brown dash line), a 50 EMA (blue dash line) and
an 8 SMA of the20 EMA (pink solid line). The momentum indicator is also slightly different from the weekly/monthly
charts – here I use a 12 period calculation (vs 8 SMA period for the weekly/monthly charts)."
Leaf's website has gone but I if you are interested in his methods message me.
What is different from my previous RS: The RS now displays RS candles. So if you prefer to watch price action of candles to
a line chart which only plots the ratio of closes then this will be more interesting to you.
I have also thrown in a few options to have fun with.
Jayy
Versionshinweise
Script stopped functioning as a result of the use of XX in the script which is no longer a valid security.Versionshinweise
NCOpen-source Skript
Ganz im Sinne von TradingView hat dieser Autor sein/ihr Script als Open-Source veröffentlicht. Auf diese Weise können nun auch andere Trader das Script rezensieren und die Funktionalität überprüfen. Vielen Dank an den Autor! Sie können das Script kostenlos verwenden, aber eine Wiederveröffentlichung des Codes unterliegt unseren Hausregeln.
Jayy
Haftungsausschluss
Die Informationen und Veröffentlichungen sind nicht als Finanz-, Anlage-, Handels- oder andere Arten von Ratschlägen oder Empfehlungen gedacht, die von TradingView bereitgestellt oder gebilligt werden, und stellen diese nicht dar. Lesen Sie mehr in den Nutzungsbedingungen.
Open-source Skript
Ganz im Sinne von TradingView hat dieser Autor sein/ihr Script als Open-Source veröffentlicht. Auf diese Weise können nun auch andere Trader das Script rezensieren und die Funktionalität überprüfen. Vielen Dank an den Autor! Sie können das Script kostenlos verwenden, aber eine Wiederveröffentlichung des Codes unterliegt unseren Hausregeln.
Jayy
Haftungsausschluss
Die Informationen und Veröffentlichungen sind nicht als Finanz-, Anlage-, Handels- oder andere Arten von Ratschlägen oder Empfehlungen gedacht, die von TradingView bereitgestellt oder gebilligt werden, und stellen diese nicht dar. Lesen Sie mehr in den Nutzungsbedingungen.