PROTECTED SOURCE SCRIPT
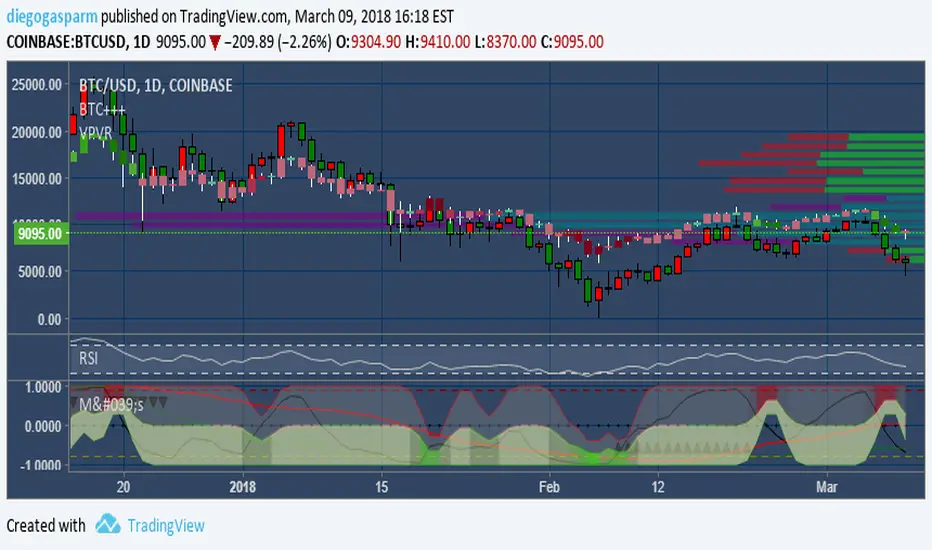
M waves Mk3 'Magical M's

So quick code update clean and script is now open for everyone! yay!....
as always adjust before using with safe and smooth parameters... you prob do not want to deviate too much from default values tho.
i use this indicator combined with the other frequency one to help me identify time and direction of next move.
quick how to use:
red means sell
green means buy
similar to rsi you want to buy/sell when the indicator turns green/red and lines are as pinched as posible (the lines that are being filled).
keep an eye on the other line that moves around ;) if its not matching the other 2 moving averages and the main color indicator chances are its a trap(works both ways)
use the candles to help you keep your eye on the indicator when scalping (look at the original post for some color ideas)
there is a ton more that i unfortunately do not have time to explain so let me go on to the sad news
i cant overwork myself anymore(cts both hands is a bitch) so updates will slow considerably... if there are any at all :( ) so drop ideas by dm or in comments on what i should work on next , and wish us luck as im prob gona need it .
catch you guys hopefully in a week with new updates
D
Geschütztes Skript
Dieses Script ist als Closed-Source veröffentlicht. Sie können es kostenlos und ohne Einschränkungen verwenden – erfahren Sie hier mehr.
Haftungsausschluss
Die Informationen und Veröffentlichungen sind nicht als Finanz-, Anlage-, Handels- oder andere Arten von Ratschlägen oder Empfehlungen gedacht, die von TradingView bereitgestellt oder gebilligt werden, und stellen diese nicht dar. Lesen Sie mehr in den Nutzungsbedingungen.