PROTECTED SOURCE SCRIPT
Aktualisiert Historical Volatility Close to Close VS High to Low
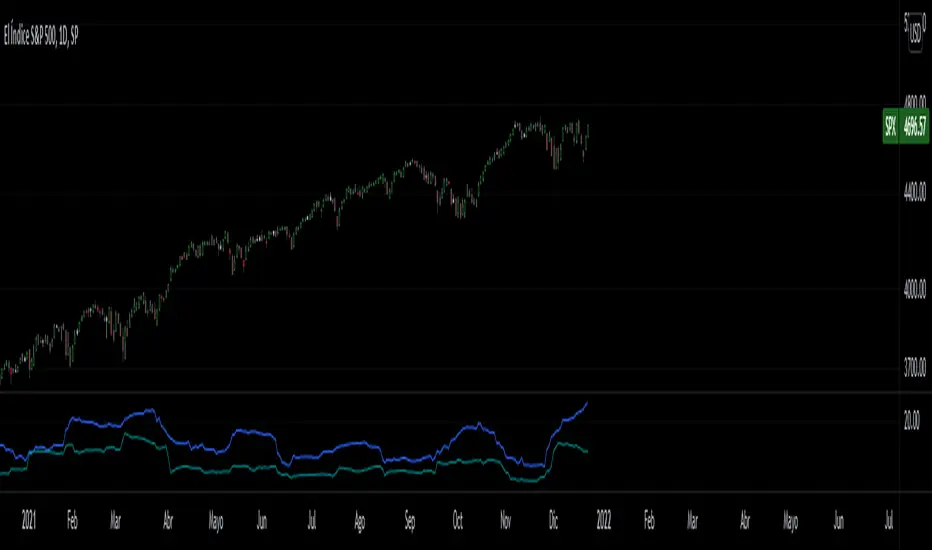
Close to Close Volatility VS high to low, to evaluate volatility regimes.
Both are Volatilities of 40 periods (Modifiable), calculated on 252 days (Average trading days in the American market) (Also modifiable in the case of cryptocurrency analysis).
The Moving Average is a 20 periods (Modifiable) Simple Moving Average of the average of both volatilities.
Blue = Close to Close Volatility
Green = High to Low Volatility
Orange = Moving Average
Volatilidad Close to Close VS High to Low, para evaluar regimenes de volatilidad historica.
Ambas son Volatilidades de 40 periodos (Modificable), calculadas sobre 252 dias (Promedio de dias operables en el mercado americano)(Tambien modificable para el caso de analisis de criptomonedas).
La Media movil, es una media movil Simple de 20 periodos del promedio de ambas volatilidades.
Azul = Volatilidad Close to Close
Verde = Volatilidad High to low
Naranja = Media Movil
Versionshinweise
Days/Dias= 252-->262Length/Periodos= 40-->20
Moving Average/Media Movil = X
Versionshinweise
ChartGeschütztes Skript
Dieses Script ist als Closed-Source veröffentlicht. Sie können es kostenlos und ohne Einschränkungen verwenden – erfahren Sie hier mehr.
Haftungsausschluss
Die Informationen und Veröffentlichungen sind nicht als Finanz-, Anlage-, Handels- oder andere Arten von Ratschlägen oder Empfehlungen gedacht, die von TradingView bereitgestellt oder gebilligt werden, und stellen diese nicht dar. Lesen Sie mehr in den Nutzungsbedingungen.
Geschütztes Skript
Dieses Script ist als Closed-Source veröffentlicht. Sie können es kostenlos und ohne Einschränkungen verwenden – erfahren Sie hier mehr.
Haftungsausschluss
Die Informationen und Veröffentlichungen sind nicht als Finanz-, Anlage-, Handels- oder andere Arten von Ratschlägen oder Empfehlungen gedacht, die von TradingView bereitgestellt oder gebilligt werden, und stellen diese nicht dar. Lesen Sie mehr in den Nutzungsbedingungen.