OPEN-SOURCE SCRIPT
Window Periods
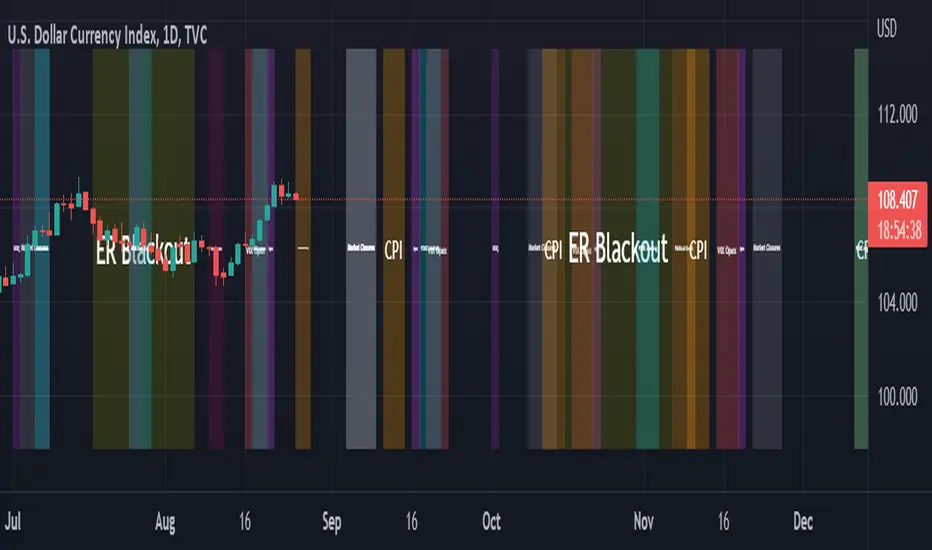
// Work in progress.. visualize event windows
// to do:
// - assign sector relevance (add opec events and weight more to commodity typed instruments, whereas revenue forecasts of walmart won't be as relevant to commodities)
// - create weighting onto macro probability valuators
// - create means to store window weight/values in an accessible way so that additional scripts can access this data (post hidden text in window?) or maybe just duplicate arrays elsewhere in additional code (terrible option)
// - correct colors to scale within like types of events (opex the same, rebalancing periods the same, political and financial meeting the same color etc..)
// - find a way to make transfer the timestamps or date strings as const variables usable within functions. v5 sends as series and cannot be converted back making this an overly complicated case instead of a function/library
// - add dates back to 2017 for better referencing
// - convert a number of the variables to inputs so they can be controlled in-chart, such as transparancy, and color of each window period?
Open-source Skript
Ganz im Sinne von TradingView hat dieser Autor sein/ihr Script als Open-Source veröffentlicht. Auf diese Weise können nun auch andere Trader das Script rezensieren und die Funktionalität überprüfen. Vielen Dank an den Autor! Sie können das Script kostenlos verwenden, aber eine Wiederveröffentlichung des Codes unterliegt unseren Hausregeln.
Tilden
Haftungsausschluss
Die Informationen und Veröffentlichungen sind nicht als Finanz-, Anlage-, Handels- oder andere Arten von Ratschlägen oder Empfehlungen gedacht, die von TradingView bereitgestellt oder gebilligt werden, und stellen diese nicht dar. Lesen Sie mehr in den Nutzungsbedingungen.