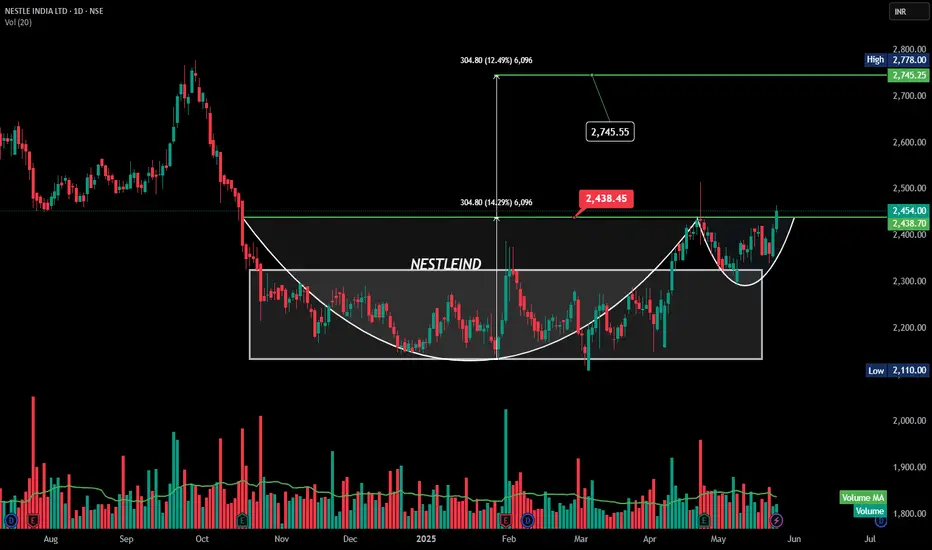
This chart of **Nestle India Ltd** shows a **Cup and Handle** breakout pattern — a strong bullish continuation signal.
---
### 🟢 **Cup & Handle Breakout – Nestle India Ltd**
#### **Pattern Highlights:**
* **Cup Formation:** Long rounding bottom from Nov 2024 to April 2025.
* **Handle:** Minor consolidation and dip in May 2025.
* **Breakout Point (Neckline):** ₹2,438.45
* **Target Projection:**
Height of cup ≈ ₹305
📈 Target = ₹2,438 + ₹305 = **₹2,745** (marked)
### ✅ Key Takeaways:
* **Breakout is with volume**, confirming strength.
* **Next resistance zones**: ₹2,745.60 and ₹2,768.60.
* **Supports post-breakout**: ₹2,438 (neckline).
Would you like a full YouTube-ready set (title, description, tags, disclaimer) for this chart as well?
Haftungsausschluss
Die Informationen und Veröffentlichungen sind nicht als Finanz-, Anlage-, Handels- oder andere Arten von Ratschlägen oder Empfehlungen gedacht, die von TradingView bereitgestellt oder gebilligt werden, und stellen diese nicht dar. Lesen Sie mehr in den Nutzungsbedingungen.
Haftungsausschluss
Die Informationen und Veröffentlichungen sind nicht als Finanz-, Anlage-, Handels- oder andere Arten von Ratschlägen oder Empfehlungen gedacht, die von TradingView bereitgestellt oder gebilligt werden, und stellen diese nicht dar. Lesen Sie mehr in den Nutzungsbedingungen.