Using Andrews to determine where the market is likely to go!
Part 1 : Direction
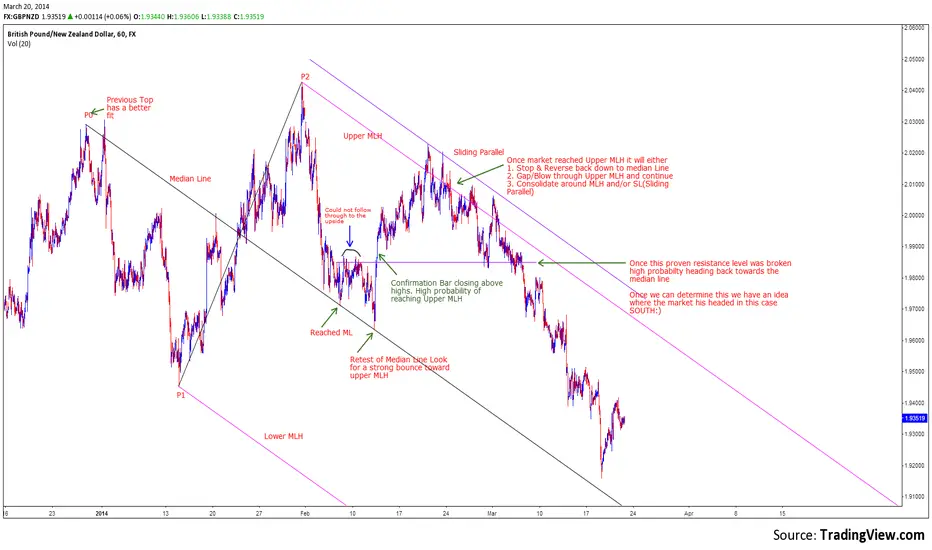
This is a 60 minute chart of the GBP/NZD pair. It was drawn after the first touch of the median line.
The horizontal purple support & resistance line within the median line set gives us directional bias as to market direction. In part two I will zoom in closer and see what the forks are telling me.
This is a 60 minute chart of the GBP/NZD pair. It was drawn after the first touch of the median line.
The horizontal purple support & resistance line within the median line set gives us directional bias as to market direction. In part two I will zoom in closer and see what the forks are telling me.
Haftungsausschluss
Die Informationen und Veröffentlichungen sind nicht als Finanz-, Anlage-, Handels- oder andere Arten von Ratschlägen oder Empfehlungen gedacht, die von TradingView bereitgestellt oder gebilligt werden, und stellen diese nicht dar. Lesen Sie mehr in den Nutzungsbedingungen.
Haftungsausschluss
Die Informationen und Veröffentlichungen sind nicht als Finanz-, Anlage-, Handels- oder andere Arten von Ratschlägen oder Empfehlungen gedacht, die von TradingView bereitgestellt oder gebilligt werden, und stellen diese nicht dar. Lesen Sie mehr in den Nutzungsbedingungen.