Technical :
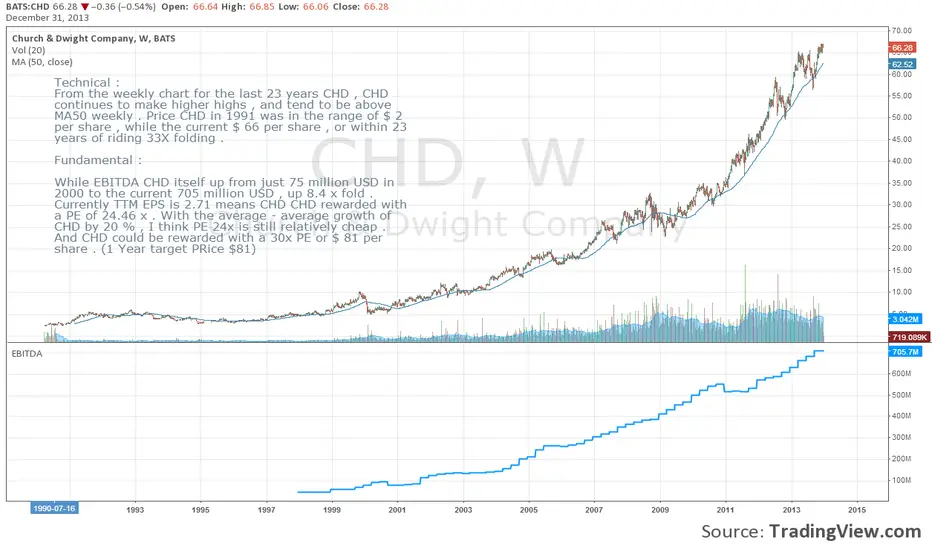
From the weekly chart for the last 23 years CHD , CHD continues to make higher highs , and tend to be above MA50 weekly . Price CHD in 1991 was in the range of $ 2 per share , while the current $ 66 per share , or within 23 years of riding 33X folding .
Fundamental :
While EBITDA CHD itself up from just 75 million USD in 2000 to the current 705 million USD , up 8.4 x fold . Currently TTM EPS is 2.71 means CHD CHD rewarded with a PE of 24.46 x . With the average - average growth of CHD by 20 % , I think PE 24x is still relatively cheap . And CHD could be rewarded with a 30x PE or $ 81 per share . (1 Year target PRice $81)
more on dow20001.com/?p=16
Haftungsausschluss
Die Informationen und Veröffentlichungen sind nicht als Finanz-, Anlage-, Handels- oder andere Arten von Ratschlägen oder Empfehlungen gedacht, die von TradingView bereitgestellt oder gebilligt werden, und stellen diese nicht dar. Lesen Sie mehr in den Nutzungsbedingungen.
Haftungsausschluss
Die Informationen und Veröffentlichungen sind nicht als Finanz-, Anlage-, Handels- oder andere Arten von Ratschlägen oder Empfehlungen gedacht, die von TradingView bereitgestellt oder gebilligt werden, und stellen diese nicht dar. Lesen Sie mehr in den Nutzungsbedingungen.