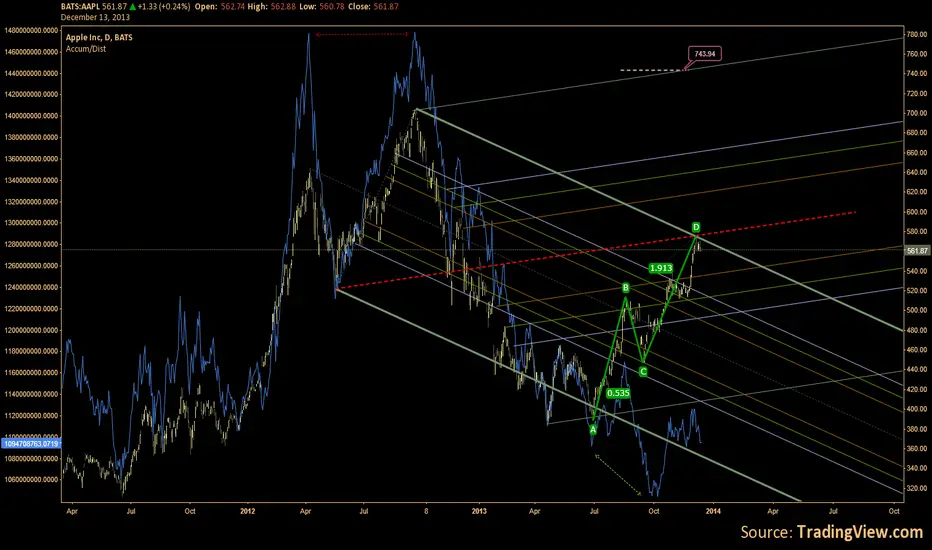
It is getting interesting this chart. The AB=CD finished the pattern and the price is hitting into a cluster of resistances. However, more noticeable is the accumulation/distribution line projected behind the price.
For few years, the A/D line followed in tandem the price confirming the trends strength- being on the upside or downside. For the last months the A/D line failed to follow the price and is moving on the opposite direction and it could be interpreted as selling pressure is beginning to increase. While there is clear a bullish divergence, the latest divergence shows weakness in uptrend.
it is best to allow a week or two for the other signals to develop.
Haftungsausschluss
Die Informationen und Veröffentlichungen sind nicht als Finanz-, Anlage-, Handels- oder andere Arten von Ratschlägen oder Empfehlungen gedacht, die von TradingView bereitgestellt oder gebilligt werden, und stellen diese nicht dar. Lesen Sie mehr in den Nutzungsbedingungen.
Haftungsausschluss
Die Informationen und Veröffentlichungen sind nicht als Finanz-, Anlage-, Handels- oder andere Arten von Ratschlägen oder Empfehlungen gedacht, die von TradingView bereitgestellt oder gebilligt werden, und stellen diese nicht dar. Lesen Sie mehr in den Nutzungsbedingungen.