Indikatoren, Strategien und Bibliotheken
Relative volume or RVOL for short is an indicator that is used to measure how 'In Play' the stock is. Simply put, it helps to quantify how interested everybody is in the given stock - higher the value, higher the interest and hence higher is the probability for movement in the stock. I have tried to create RVOL (Relative Volume ) Indicator as per the description...
These are volume columns on steroids, for serious volume users. You can use the indicator to show volume columns or relative volume. You can define alerts using numerous conditions in both column and relative modes simultaneously. Multiple coloring schemes allow you to reveal volume columns in a much more useful light than the two-color standard. Features...
This indicator colors the volume bars based on any of the three follow criteria: - Volume Amount - RVOL (Relative Volume) - Lookback (Highest Over Period) You can use one, two or all three of these settings at the same time. You can also set alerts with this indicator. The script will trigger an alert whenever any of the three specified flags are triggered. ...
This indicator was originally developed by Donald Dorsey (Stocks & Commodities, V.13:9 (September, 1995): "Refining the Relative Volatility Index"). Inertia is based on Relative Volatility Index (RVI) smoothed using linear regression. In physics, inertia is the tendency of an object to resist to acceleration. Dorsey chose this name because he believes that trend...
My first script. By Vitali Apirine. Technical Analysis of Stocks & Commodities ( February 2018, Vol.36 Issue 2). Thank you.
Use this indicator to compare how security is performing in compare with preferred index (SPX by default). > 0 outperforming < 0 underperforming Works best for weekly, but can be applied to monthly and daily charts. It will be rather useless to use it in smaller timeframes Apply it to SPX, industry index, sector index or other security in similar sector
As you can see in the chart below, regular ATR is not useful for long term analysis. Normalizing it, fixes the issue. This indicator can be used to measure absolute volatility. It has a built-in stochastic as well for relative volatility. ATR counts high and low in the equation unlike Bolinger Band Width. Stochastic:
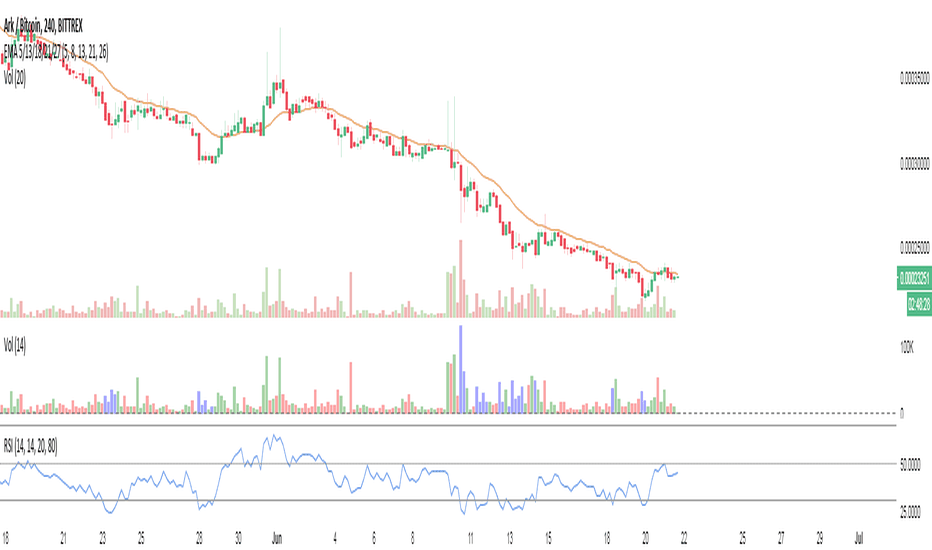
I present you my last indicator. A volume indicator that indicates overbought and oversold based on the rsi, I chose the rsi because the most used surment, this indicator allows you to identify the overbought and oversold areas of the rsi with the colors blue (oversold) and orange (overbought ) on the volume indicator! Hoping that you are useful
Relative strength is a ratio between two assets, most often a stock and a market average (index). This implementation uses the method described here and the second method described here to calculate its value: "To calculate the relative strength of a particular stock, divide the percentage change over some time period by the percentage change of a particular...
Relative Vigor Index with Dominant Cycle Detection. As Ehler's mentioned, fixed length look back is inherently flawed when it is possible to extract a length from a dominant price cycle. may be less effective if signal to noise ratio is greater than 2, but that usually would not happen at >5m candles, and honestly shouldn't be looking at RV(igor)I when price is...
Relative Momentum Index indicator script. This indicator was originally developed by Roger Altman (Stocks & Commodities V. 11:2 (57-60)). RMI with momentum period of 1 will be equal to an RSI when they have the same period and source price.
This is the Relative Vigor Index indicator just multiplied by 100 to have non-zero integer part
This is an indicator for Indian markets. It shows the relative strength of particular stock to the underlying index. The concept of this indicator is well described in Stan Weinstein's book.
Relative Strength Index with indicator lines at 20, 30, 50, 70 and 80 marks. Use settings to show/hide these lines, and to choose appropriate colors.


![Volume Columns w. Alerts (V) [LucF] MSFT: Volume Columns w. Alerts (V) [LucF]](https://s3.tradingview.com/i/iIDX6rXZ_mid.png)


![Normalized Average True Range (NATR) (Volatility) [cI8DH] BLX: Normalized Average True Range (NATR) (Volatility) [cI8DH]](https://s3.tradingview.com/l/LUvQgXce_mid.png)


