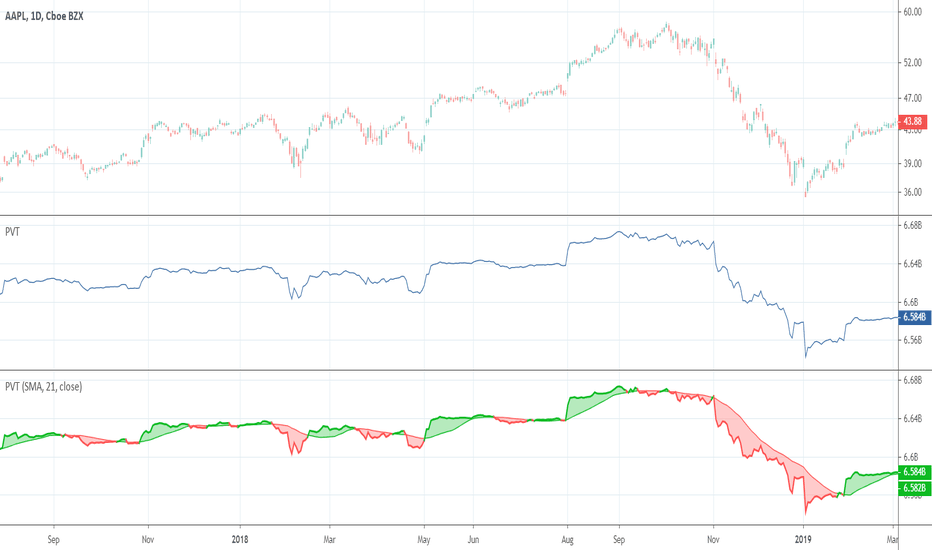
Price Volume Trend (PVT)
Indikatoren, Strategien und Bibliotheken
an underlying asset. It is determined by the changes in price and volume. The volume acts as a weighting coefficient at the change of price — the higher the coefficient (the volume) is the greater the contribution of the price change (for this period of time) will be in the value of the indicator. The indicator is also known as Accumulation / Distribution...
Put lines above and below current price by a specified value. The step value refers to the mintick value of the symbol. (e.g. BTCUSD has a mintick value of 0.01 so if you wanted an increment of $12.50 you would use 1250 for the number of steps between value)
Arrow at candle where bullish or bearish gap occurred by a configurable minimum pip distance
Sessions script with ability to toggle which days sessions are shown.
Place round number lines by step amount above and below bar
In this script I included 2 quite interesting indicators for Bitcoin: * NVT (Network Value to Transactions Ratio) * NVTS (NVT Signal) Both indicators are based on Bitcoin Network Value (Market Cap) and 24h transaction volume. For both these values I'm using Quandl datasets from Blockchainc.com: market_cap: QUANDL:BCHAIN/MKTCP transac_vol:...
Oscillator plots cumulative volume with direction defined by price (positive price change = positive volume and vice versa) divided by volume sma. It is good for divergence indication and can be used for trend change prediction. It is faster then stoch with the same length.
English: This script shows the price development over the last year (default: green) and mean prices over the last three (default: light green), six (default: orange) and nine (default: red) years and is therefore at least some kind of approach towards true seasonality. Thanks to user "apozdnyakov" for providing most of the code! Deutsch: Dieses Skript zeigt...
Volume indicator adapted from Elder's Force Index. From here: stageanalysis.net
// The Stock Market Institute (SMI) describes an propriety indicator the "SMI Wyckoff Wave" for US Stocks. This code is an attempt to make a Wyckoff Wave for the Johannesburg Stock Exchange (JSE). // The JSE Wyckoff Wave is in a separate code. This is the code for the volume of the wave. Please see code for the JSE Wyckoff Wave which goes with this indicator. //...
this is simple volume indicator by price see the following trend- when the candle is red there is spike in volume before the rise up and next green candle. the indicator will deflect down with green -the stronger the volume the stronger the down deflection, the next bar will be green and strong up. with down it will be opposite
These are Emini-Watch's free indicators, Better X-Trend and Better Volume paint bar. For more information go to: emini-watch.com emini-watch.com
This indicator shows Accumulation/Distribution level which can be used for confirming trends or reversals (via divergence). It is an alternative to Chaikin's Accumulation/Distribution Line (ADL) and On Balance Volume (OBV) indicators. It can also replicate PVT and OBV via options in the input menu. Here is a comparison of four related indicators: OBV is too...
This is a simple yet powerful indicator that can replace volume, Money Flow, Chaikin Money Flow, Price Volume Trend (PVT), Accumulation/Distribution Line (ADL), On Balance Volume (OBV). When "Baseline Chart" option is disabled, it looks similar to regular volume. The volume bars has two shades of green and red. The dark shade shows amount of accumulation and the...
Uses the active ticker to show long/short values on all Bitfinex pairs that have that data available on Tradingview.
Is Price Action Higher or Lower on STRONG or WEAK VOLUME from lookback (Strong or Weak Bulls // Strong or Weak Bears) Candles / Bars Indicate the Following (default 13 period lookback / Length) MAROON Bear Candle with STRONG VOLUME more than 150% of the lookback / length (13 default), STRONG Bear Candle Confirmed With Volume RED Bear Candle while VOLUME is...
![ADL - Accumulation Distribution Line [UTS] ETHUSD: ADL - Accumulation Distribution Line [UTS]](https://s3.tradingview.com/u/uRMAN1ho_mid.png)


![Accumulation/Distribution Level (ADL) [Cyrus c|:D] BTCUSD: Accumulation/Distribution Level (ADL) [Cyrus c|:D]](https://s3.tradingview.com/w/Wj4NvOBH_mid.png)


