Previous N Periods High/Low RaysOverview
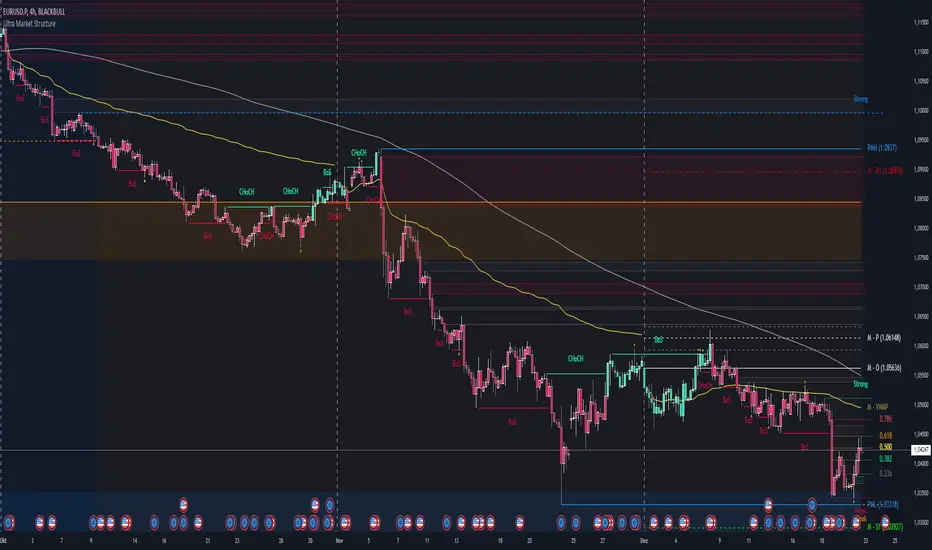
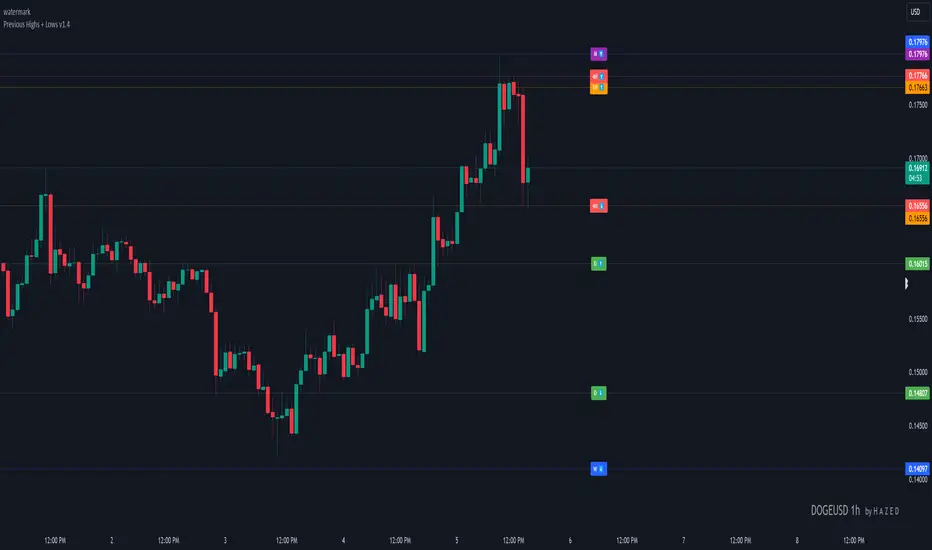
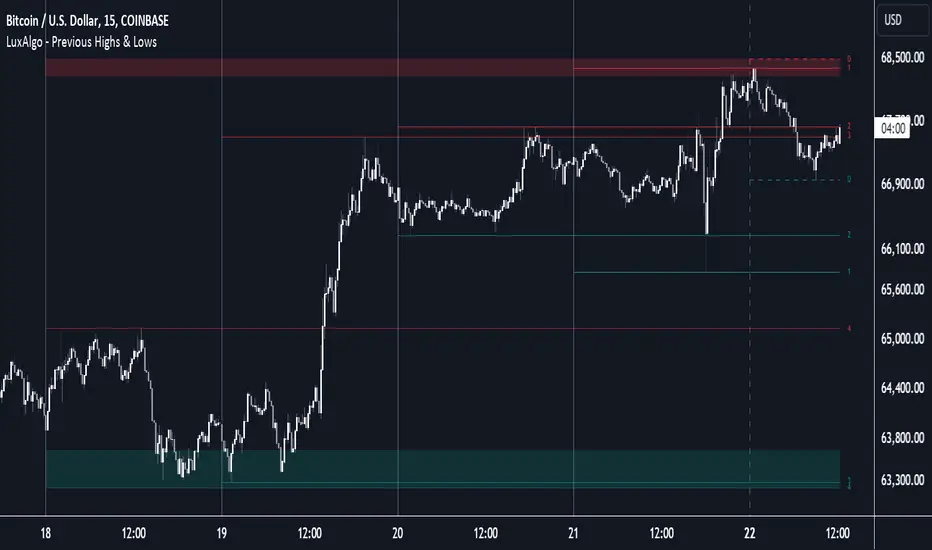
The Previous N Periods High/Low Rays indicator is a clean, powerful tool designed to help traders automatically identify and visualize key support and resistance levels from past trading periods.
Instead of manually drawing horizontal lines at previous daily, weekly, or intraday highs and lows, this indicator does the heavy lifting for you. It plots infinite horizontal rays right from the exact candle that formed the extreme high or low of your chosen period, giving you precise visual
Indikator