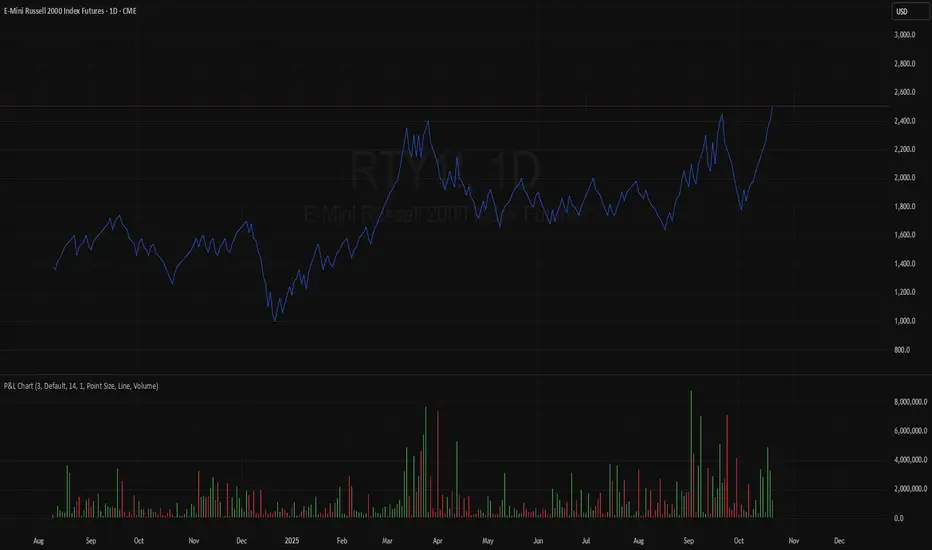
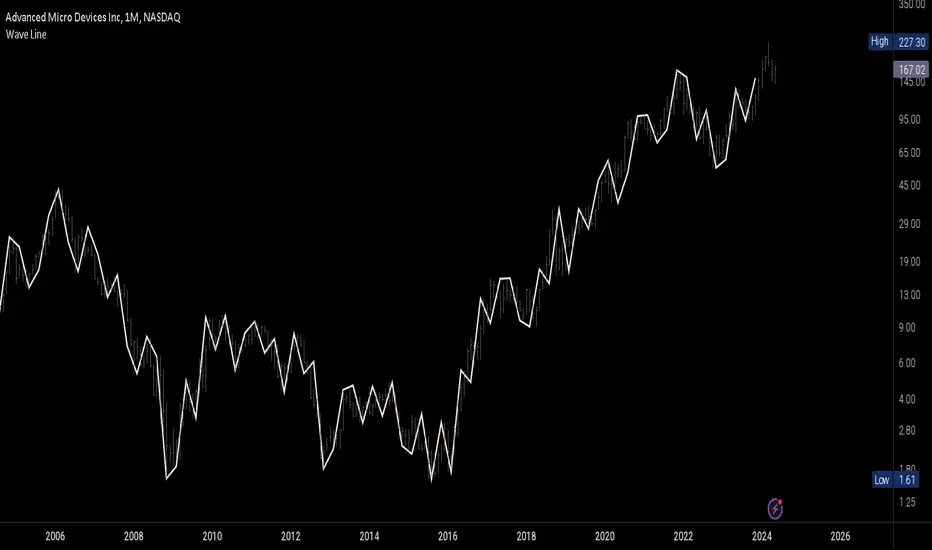
TASC 2025.11 The Points and Line Chart█ OVERVIEW
This script implements the Points and Line Chart described by Mohamed Ashraf Mahfouz and Mohamed Meregy in the November 2025 edition of the TASC Traders' Tips , "Efficient Display of Irregular Time Series”. This novel chart type interprets regular time series chart data to create an irregular time series chart.
█ CONCEPTS
When formatting data for display on a price chart, there are two main categorizations of chart types: regular time series (RTS) and irregular time series (ITS

Indikator