Repainting
Introduction
We define repainting as: script behavior causing historical vs realtime calculations or plots to behave differently.
Repainting behavior is widespread and many factors can cause it. Following our definition, our estimate is that more than 95% of indicators in existence exhibit some form of repainting behavior. Commony used indicators such as MACD and RSI, for example, show confirmed values on historical bars, but will fluctuate on a realtime, unconfirmed chart bar until it closes. Therefore, they behave differently in historical and realtime states.
Not all repainting behavior is inherently useless or misleading, nor does such behavior prevent knowledgeable traders from using indicators with such behavior. For example, who would think of discrediting a volume profile indicator solely because it updates its values on realtime bars?
One may encounter any of the following forms of repainting in the scripts they use, depending on what a script’s calculations entail:
- Widespread but often acceptable: A script may use values that update with realtime price changes on the unconfirmed bar. For example, if one uses the close variable in calculations performed on an open chart bar, its values will reflect the most recent price in the bar. However, the script will only commit a new data point to its historical series once the bar closes. Another common case is using request.security() to fetch higher-timeframe data on realtime bars, as explained in the Historical and realtime behavior section of the Other timeframes and data page. As with the unconfirmed chart bar in the chart’s timeframe, request.security() can track unconfirmed values from a higher-timeframe context on realtime bars, which can lead to repainting after the script restarts its execution. There is often nothing wrong with using such scripts, provided you understand how they work. When electing to use such scripts to issue alerts or trade orders, however, it’s important to understand the difference between their realtime and historical behavior and decide for yourself whether it provides utility for your needs.
- Potentially misleading: Scripts that plot values into the past, calculate results on realtime bars that one cannot replicate on historical bars,
or relocate past events are potentially misleading. For example, Ichimoku, most scripts based on pivots, most strategies using
calc_on_every_tick = true, scripts using request.security() when it behaves differently on realtime bars, many scripts using varip, many scripts using timenow, and some scripts that usebarstate.*variables can exhibit misleading repainting behavior. - Unacceptable: Scripts that leak future information into the past, strategies that execute on non-standard charts, and scripts using realtime intrabars to generate alerts or orders, are examples that can produce heavily misleading repainting behavior.
- Unavoidable: Revisions of the data feed from a provider and variations in the starting bar of the chart’s history can cause repainting behavior that may be unavoidable in a script.
The first two types of repainting can be perfectly acceptable if:
- You are aware of the behavior.
- You can live with it, or
- You can circumvent it.
It should now be clear that not all repainting behavior is wrong and requires avoiding at all costs. In many situations, some forms of repainting may be exactly what a script needs. What’s important is to know when repainting behavior is not acceptable for one’s needs. To avoid repainting that’s not acceptable, it’s important to understand how a tool works or how you should design the tools you build. If you publish scripts, ensure you mention any potentially misleading behavior along with the other limitations of your script in the publication’s description.
Note
We will not discuss the perils of using strategies on non-standard charts, as this problem is not related to repainting. See the Backtesting on Non-Standard Charts: Caution! script for a discussion of the subject.
For script users
One can decide to use repainting indicators if they understand the behavior, and whether that behavior meets their analysis requirements. Don’t be one of those newcomers who slap “repaint” sentences on published scripts in an attempt to discredit them, as doing so reveals a lack of foundational knowledge on the subject.
Simply asking whether a script repaints is relatively meaningless, given that there are forms of repainting behavior that are perfectly acceptable in a script. Therefore, such a question will not beget a meaningful answer. One should instead ask specific questions about a script’s potential repainting behavior, such as:
- Does the script calculate/display in the same way on historical and realtime bars?
- Do alerts from the script wait for the end of a realtime bar before triggering?
- Do signal markers shown by the script wait for the end of a realtime bar before showing?
- Does the script plot/draw values into the past?
- Does the strategy use
calc_on_every_tick = true? - Do the script’s request.security() calls leak future information into the past on historical bars?
What’s important is that you understand how the tools you use work, and whether their behavior is compatible with your objectives, repainting or not. As you will learn if you read this page, repainting is a complex matter. It has many faces and many causes. Even if you don’t program in Pine Script™, this page will help you understand the array of causes that can lead to repainting, and hopefully enable more meaningful discussions with script authors.
For Pine Script™ programmers
As discussed above, not all forms of repainting behavior must be avoided at all costs, nor is all potential repainting behavior necessarily avoidable. We hope this page helps you better understand the dynamics at play so that you can design your trading tools with these behaviors in mind. This page’s content should help make you aware of common coding mistakes that produce misleading repainting results.
Whatever your design decisions are, if you publish your script, explain the script to traders so they can understand how it behaves.
This page covers three broad categories of repainting causes:
Historical vs realtime calculations
Fluid data values
Historical data does not include records of intermediary price movements on bars; only open, high, low and close values (OHLC).
On realtime bars (bars running when the instrument’s market is open), however, the high, low and close values are not fixed; they can change values many times before the realtime bar closes and its HLC values are fixed. They are fluid. This leads to a script sometimes working differently on historical data and in real time, where only the open price will not change during the bar.
Any script using values like high, low and close in realtime is subject to producing calculations that may not be repeatable on historical bars — thus repaint.
Let’s look at this simple script. It detects crosses of the close value (in the realtime bar, this corresponds to the current price of the instrument) over and under an EMA:
//@version=5
indicator("Repainting", "", true)
ma = ta.ema(close, 5)
xUp = ta.crossover(close, ma)
xDn = ta.crossunder(close, ma)
plot(ma, "MA", color.black, 2)
bgcolor(xUp ? color.new(color.lime, 80) : xDn ? color.new(color.fuchsia, 80) : na)
- Note that:
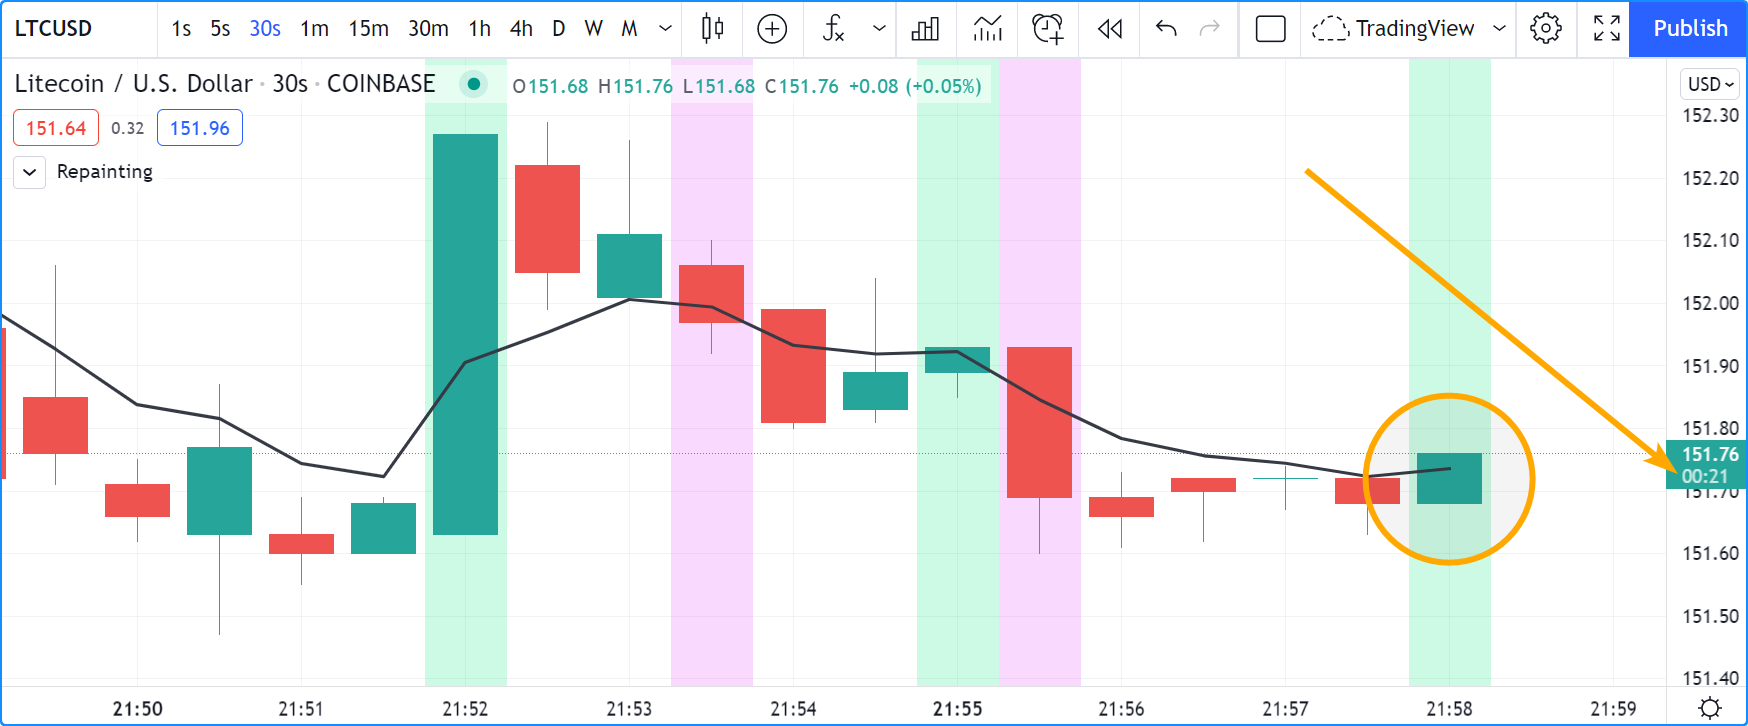
- The script uses bgcolor() to color the background green when close crosses over the EMA, and red on crosses under the EMA.
- The screen snapshot shows the script in realtime on a 30sec chart. A cross over the EMA has been detected, thus the background of the realtime bar is green.
- The problem here is that nothing guarantees this condition will hold true until the end of the realtime bar. The arrow points to the timer showing that 21 seconds remain in the realtime bar, and anything could happen until then.
- We are witnessing a repainting script.
To prevent this repainting, we must rewrite our script so that it does not use values that fluctuate during the realtime bar. This will require using values from a bar that has elapsed (typically the preceding bar), or the open price, which does not vary in realtime.
We can achieve this in many ways. This method adds a and barstate.isconfirmed
condition to our cross detections, which requires the script to be executing on the bar’s last iteration,
when it closes and prices are confirmed. It is a simple way to avoid repainting:
//@version=5
indicator("Repainting", "", true)
ma = ta.ema(close, 5)
xUp = ta.crossover(close, ma) and barstate.isconfirmed
xDn = ta.crossunder(close, ma) and barstate.isconfirmed
plot(ma, "MA", color.black, 2)
bgcolor(xUp ? color.new(color.lime, 80) : xDn ? color.new(color.fuchsia, 80) : na)
This uses the crosses detected on the previous bar:
//@version=5
indicator("Repainting", "", true)
ma = ta.ema(close, 5)
xUp = ta.crossover(close, ma)[1]
xDn = ta.crossunder(close, ma)[1]
plot(ma, "MA", color.black, 2)
bgcolor(xUp ? color.new(color.lime, 80) : xDn ? color.new(color.fuchsia, 80) : na)
This uses only confirmed close and EMA values for its calculations:
//@version=5
indicator("Repainting", "", true)
ma = ta.ema(close[1], 5)
xUp = ta.crossover(close[1], ma)
xDn = ta.crossunder(close[1], ma)
plot(ma, "MA", color.black, 2)
bgcolor(xUp ? color.new(color.lime, 80) : xDn ? color.new(color.fuchsia, 80) : na)
This detects crosses between the realtime bar’s open
and the value of the EMA from the previous bars. Notice that the EMA is calculated using
close,
so it repaints. We must ensure we use a confirmed value to detect crosses, thus ma[1]
in the cross detection logic:
//@version=5
indicator("Repainting", "", true)
ma = ta.ema(close, 5)
xUp = ta.crossover(open, ma[1])
xDn = ta.crossunder(open, ma[1])
plot(ma, "MA", color.black, 2)
bgcolor(xUp ? color.new(color.lime, 80) : xDn ? color.new(color.fuchsia, 80) : na)
All these methods have one thing in common: while they prevent repainting, they will also trigger signals later than repainting scripts. This is an inevitable compromise if one wants to avoid repainting. You can’t have your cake and eat it too.
Repainting `request.security()` calls
The request.security() function behaves differently on historical and realtime bars. On historical bars, it only returns confirmed values from its requested context, wheras it can return unconfirmed values on realtime bars. When the script restarts its execution, the bars that had a realtime state become historical bars, and will therefore only contain the values it confirmed on those bars. If the values returned by request.security() fluctuate on realtime bars without confirmation from the context, the script will repaint them when it restarts its execution. See the Historical and realtime behavior section of the Other timeframes and data page for a detailed explanation.
One can ensure higher-timeframe data requests only return confirmed values on all bars, regardless of bar state,
by offsetting the expression argument by at least one bar with the history-referencing operator
[] and using
barmerge.lookahead_on for the
lookahead argument in the request.security()
call, as explained here.
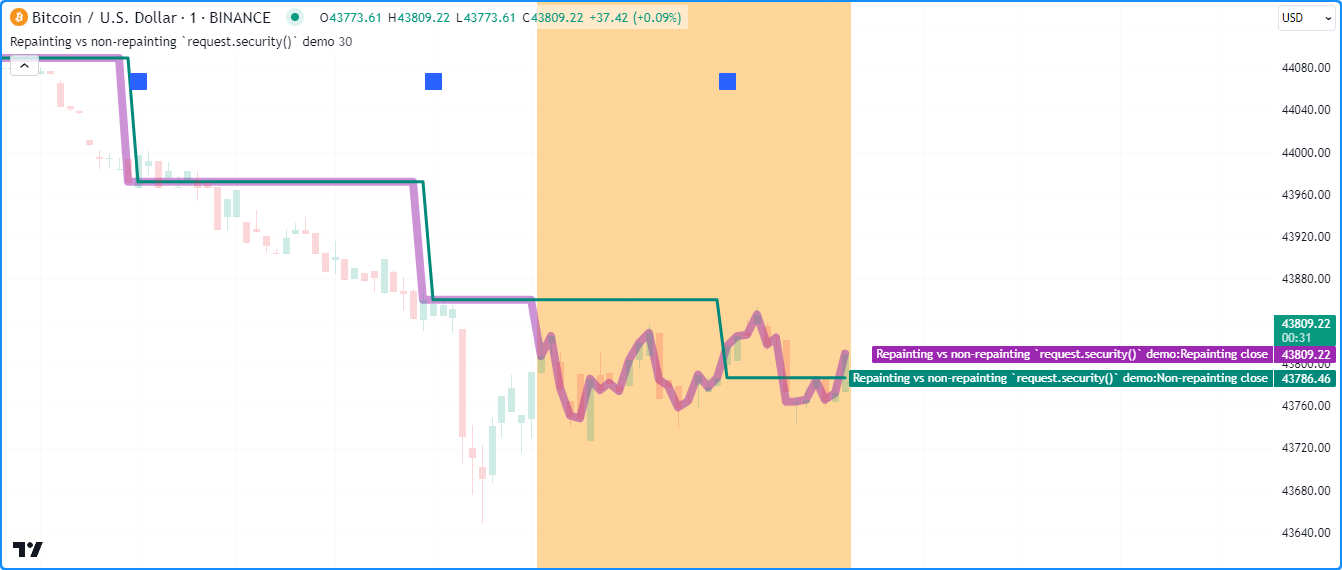
The script below demonstrates the difference between repainting and non-repainting HTF data requests.
It contains two request.security() calls.
The first function call requests close data from the
higherTimeframe without additional specification, and the second call requests the same series with an offset
and barmerge.lookahead_on.
As we see on all realtime bars
(the ones with an orange background), the repaintingClose contains values that fluctuate without confirmation from
the higherTimeframe, meaning it will repaint when the script restarts its execution. The nonRepaintingClose,
on the other hand, behaves the same on realtime and historical bars, i.e., it only changes its value when new,
confirmed data is available:
//@version=5
indicator("Repainting vs non-repainting `request.security()` demo", overlay = true)

//@variable The timeframe to request data from.
string higherTimeframe = input.timeframe("30", "Timeframe")

if timeframe.in_seconds() > timeframe.in_seconds(higherTimeframe)
    runtime.error("The 'Timeframe' input is smaller than the chart's timeframe. Choose a higher timeframe.")

//@variable The current `close` requested from the `higherTimeframe`. Fluctuates without confirmation on realtime bars.
float repaintingClose = request.security(syminfo.tickerid, higherTimeframe, close)
//@variable The last confirmed `close` requested from the `higherTimeframe`.
// Behaves the same on historical and realtime bars.
float nonRepaintingClose = request.security(
     syminfo.tickerid, higherTimeframe, close[1], lookahead = barmerge.lookahead_on
 )

// Plot the values.
plot(repaintingClose, "Repainting close", color.new(color.purple, 50), 8)
plot(nonRepaintingClose, "Non-repainting close", color.teal, 3)
// Plot a shape when a new `higherTimeframe` starts.
plotshape(timeframe.change(higherTimeframe), "Timeframe change marker", shape.square, location.top, size = size.small)
// Color the background on realtime bars.
bgcolor(barstate.isrealtime ? color.new(color.orange, 60) : na, title = "Realtime bar highlight")
- Note that:
- We used the plotshape() function to mark the chart
when there’s a change on the
higherTimeframe. - This script produces a runtime error if the
higherTimeframeis lower than the chart’s timeframe. - On historical bars, the
repaintingClosehas a new value at the end of each timeframe, and thenonRepaintingClosehas a new value at the start of each timeframe.
- We used the plotshape() function to mark the chart
when there’s a change on the
For the sake of easy reusability, below is a simple a noRepaintSecurity() function that one can apply in their
scripts to request non-repainting higher-timeframe values:
//@function Requests non-repainting `expression` values from the context of the `symbol` and `timeframe`.
noRepaintSecurity(symbol, timeframe, expression) =>
    request.security(symbol, timeframe, expression[1], lookahead = barmerge.lookahead_on)
- Note that:
- The
[1]offset to the series and the use oflookahead = barmerge.lookahead_onare interdependent. One cannot be removed without compromising the integrity of the function. - Unlike a plain request.security()
call, this wrapper function cannot accept tuple
expressionarguments. For multi-element use cases, one can pass a user-defined type whose fields contain the desired elements to request.
- The
Using `request.security()` at lower timeframes
Some scripts use request.security() to request data from a timeframe lower than the chart’s timeframe. This can be useful when functions specifically designed to handle intrabars at lower timeframes are sent down the timeframe. When this type of user-defined function requires the detection of the intrabars’ first bar, as most do, the technique will only work on historical bars. This is due to the fact that realtime intrabars are not yet sorted. The impact of this is that such scripts cannot reproduce in real time their behavior on historical bars. Any logic generating alerts, for example, will be flawed, and constant refreshing will be required to recalculate elapsed realtime bars as historical bars.
When used at lower timeframes than the chart’s without specialized functions able to distinguish between intrabars, request.security() will only return the value of the last intrabar in the dilation of the chart’s bar, which is usually not useful, and will also not reproduce in real time, so lead to repainting.
For all these reasons, unless you understand the subtleties of using request.security() at lower timeframes than the chart’s, it is best to avoid using the function at those timeframes. Higher-quality scripts will have logic to detect such anomalies and prevent the display of results which would be invalid when a lower timeframe is used.
For more reliable lower-timeframe data requests, use request.security_lower_tf(), as explained in this section of the Other timeframes and data page.
Future leak with `request.security()`
When request.security()
is used with lookahead = barmerge.lookahead_on to fetch prices without offsetting the series by [1],
it will return data from the future on historical bars, which is dangerously misleading.
While historical bars will magically display future prices before they should be known, no lookahead is possible in realtime because the future there is unknown, as it should, so no future bars exist.
This is an example:
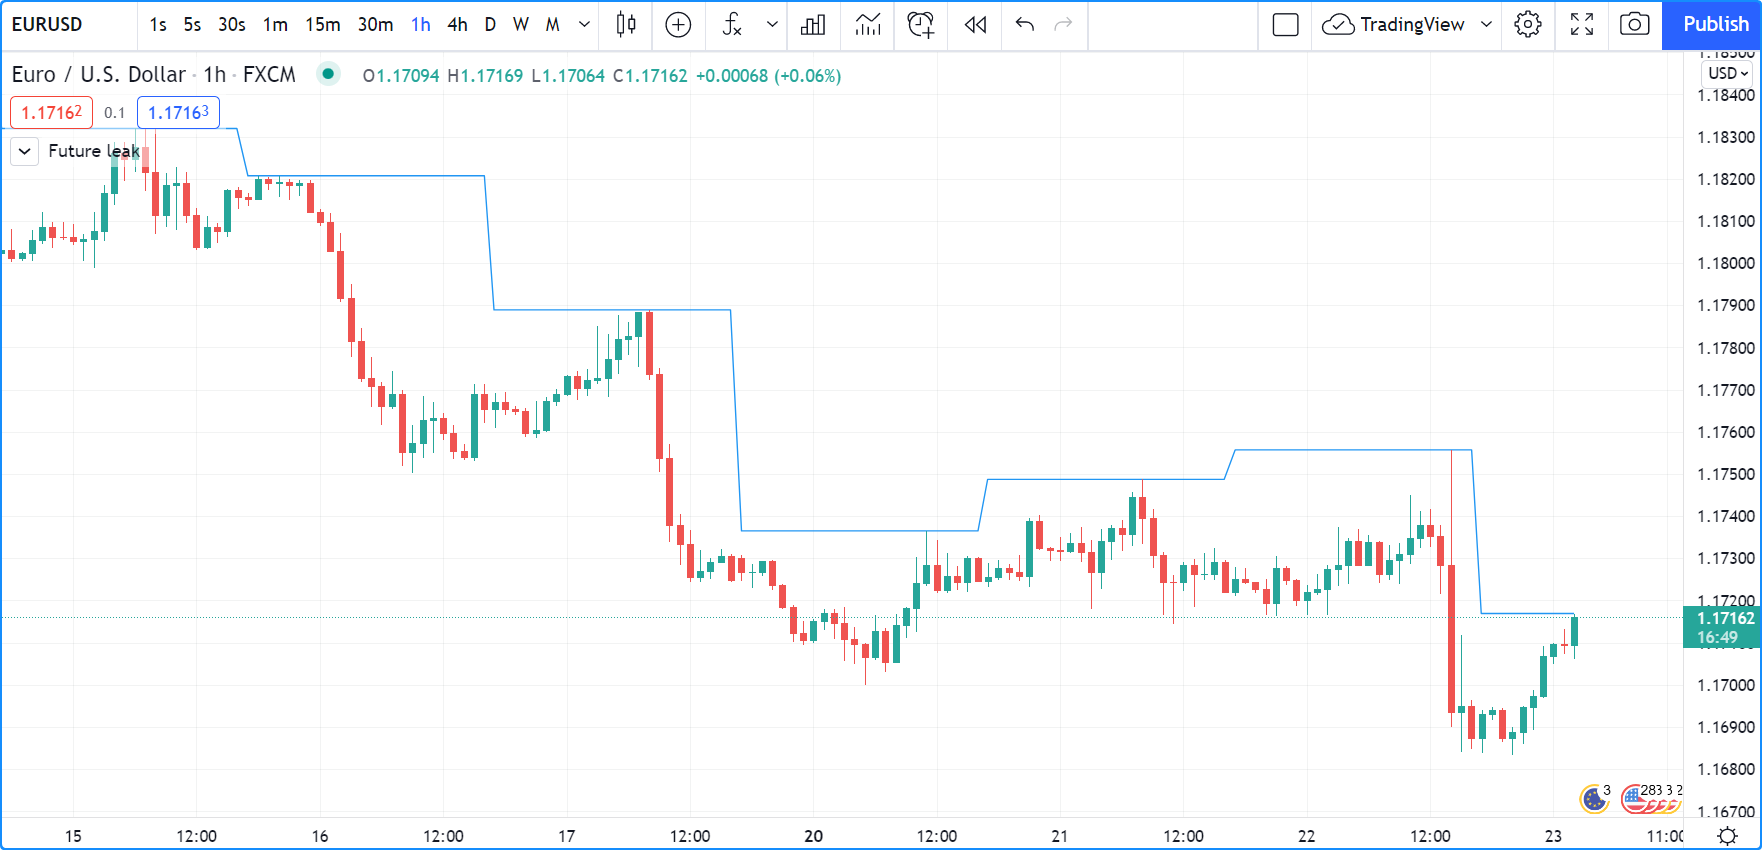
// FUTURE LEAK! DO NOT USE!
//@version=5
indicator("Future leak", "", true)
futureHigh = request.security(syminfo.tickerid, "1D", high, lookahead = barmerge.lookahead_on)
plot(futureHigh)
Note how the higher timeframe line is showing the timeframe’s high value before it occurs. The solution to avoid this effect is to use the function as demonstrated in this section.
Using lookahead to produce misleading results is not allowed in script publications, as explained in the lookahead section of the Other timeframes and data page. Script publications that use this misleading technique will be moderated.
`varip`
Scripts using the varip declaration mode for variables (see our section on varip for more information) save information across realtime updates, which cannot be reproduced on historical bars where only OHLC information is available. Such scripts may be useful in realtime, including to generate alerts, but their logic cannot be backtested, nor can their plots on historical bars reflect calculations that will be done in realtime.
Bar state built-ins
Scripts using bar states may or may not repaint.
As we have seen in the previous section, using barstate.isconfirmed
is actually one way to avoid repainting that will reproduce on historical bars, which are always “confirmed”.
Uses of other bar states such as barstate.isnew,
however, will lead to repainting. The reason is that on historical bars,
barstate.isnew is true on the bar’s
close, yet in realtime, it is true on the bar’s
open.
Using the other bar state variables will usually cause some type of behavioral discrepancy between historical and realtime bars.
`timenow`
The timenow built-in returns the current time. Scripts using this variable cannot show consistent historical and realtime behavior, so they necessarily repaint.
Strategies
Strategies using calc_on_every_tick = true execute on each realtime update,
while strategies run on the close
of historical bars. They will most probably not generate the same order executions, and so repaint.
Note that when this happens, it also invalidates backtesting results,
as they are not representative of the strategy’s behavior in realtime.
Plotting in the past
Scripts detecting pivots after 5 bars have elapsed will often go back in the past to plot pivot levels or values on the actual pivot, 5 bars in the past. This will often cause unsuspecting traders looking at plots on historical bars to infer that when the pivot happens in realtime, the same plots will apppear on the pivot when it occurs, as opposed to when it is detected.
Let’s look at a script showing the price of high pivots by placing the price in the past, 5 bars after the pivot was detected:
//@version=5
indicator("Plotting in the past", "", true)
pHi = ta.pivothigh(5, 5)
if not na(pHi)
    label.new(bar_index[5], na, str.tostring(pHi, format.mintick) + "\n🠇", yloc = yloc.abovebar, style = label.style_none, textcolor = color.black, size = size.normal)
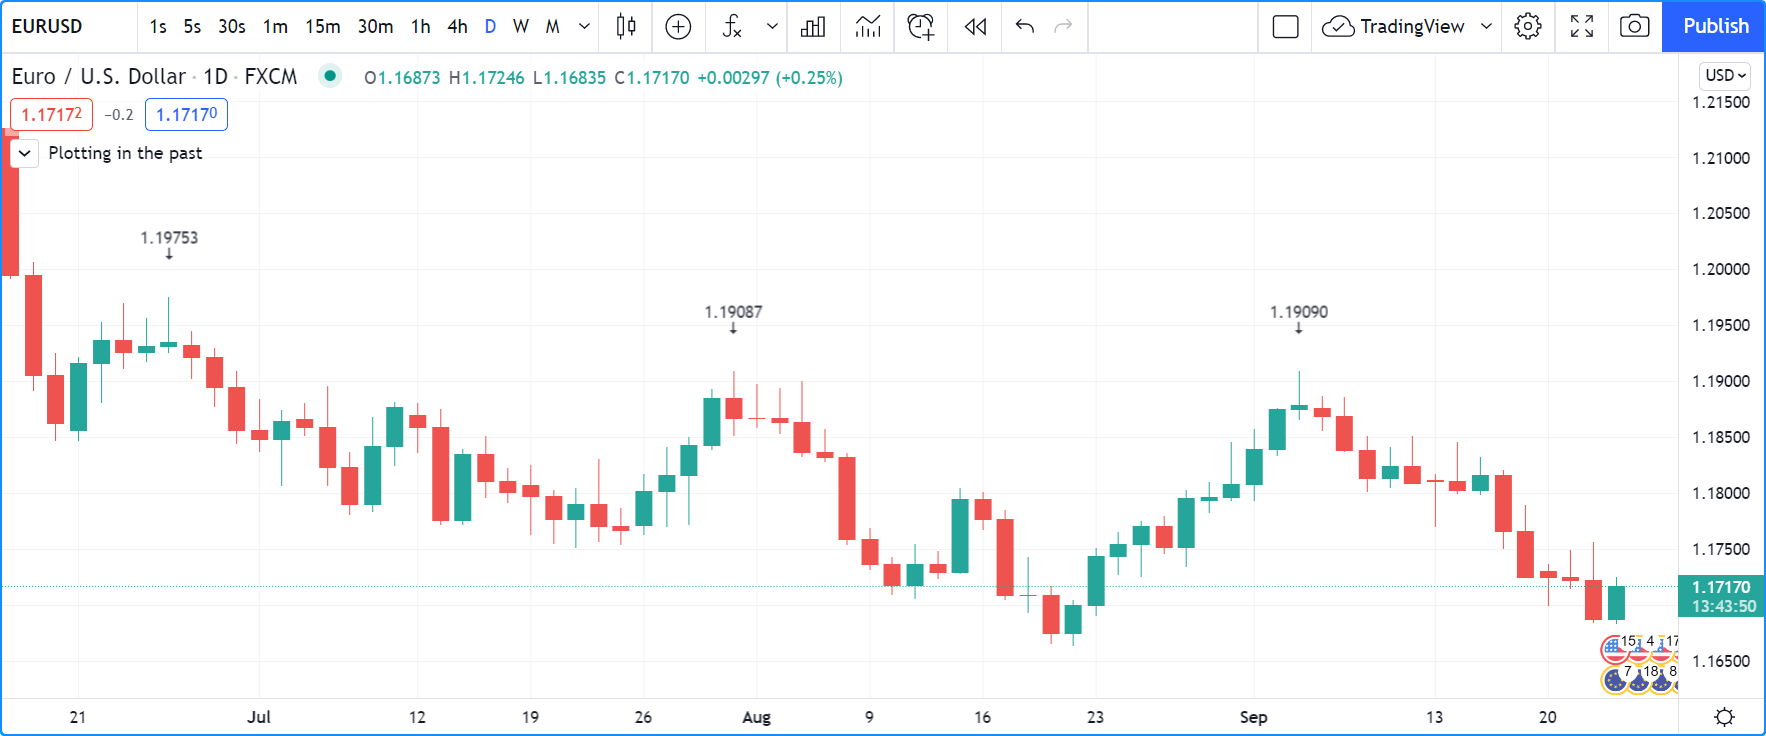
Note that:
- This script repaints because an elapsed realtime bar showing no price may get a price placed on it if it is identified as a pivot, 5 bars after the actual pivot occurs.
- The display looks great, but it can be misleading.
The best solution to this problem when developing script for others is to plot without an offset by default, but give the option for script users to turn on plotting in the past through inputs, so they are necessarily aware of what the script is doing, e.g.:
//@version=5
indicator("Plotting in the past", "", true)
plotInThePast = input(false, "Plot in the past")
pHi = ta.pivothigh(5, 5)
if not na(pHi)
    label.new(bar_index[plotInThePast ? 5 : 0], na, str.tostring(pHi, format.mintick) + "\n🠇", yloc = yloc.abovebar, style = label.style_none, textcolor = color.black, size = size.normal)
Dataset variations
Starting points
Scripts begin executing on the chart’s first historical bar, and then execute on each bar sequentially, as is explained in this manual’s page on Pine Script™’s execution model. If the first bar changes, then the script will often not calculate the same way it did when the dataset began at a different point in time.
The following factors have an impact on the quantity of bars you see on your charts, and their starting point:
- The type of account you hold
- The historical data available from the data supplier
- The alignment requirements of the dataset, which determine its starting point
These are the account-specific bar limits:
- 20000 historical bars for the Premium plan.
- 10000 historical bars for Pro and Pro+ plans.
- 5000 historical bars for other plans.
Starting points are determined using the following rules, which depend on the chart’s timeframe:
- 1, 5, 10, 15, 30 seconds: aligns to the beginning of a day.
- 1 - 14 minutes: aligns to the beginning of a week.
- 15 - 29 minutes: aligns to the beginning of a month.
- 30 - 1439 minutes: aligns to the beginning of a year.
- 1440 minutes and higher: aligns to the first available historical data point.
As time goes by, these factors cause your chart’s history to start at different points in time. This often has an impact on your scripts calculations, because changes in calculation results in early bars can ripple through all the other bars in the dataset. Using functions like ta.valuewhen(), ta.barssince() or ta.ema(), for example, will yield results that vary with early history.
Revision of historical data
Historical and realtime bars are built using two different data feeds supplied by exchanges/brokers: historical data, and realtime data. When realtime bars elapse, exchanges/brokers sometimes make what are usually small adjustments to bar prices, which are then written to their historical data. When the chart is refreshed or the script is re-executed on those elapsed realtime bars, they will then be built and calculated using the historical data, which will contain those usually small price revisions, if any have been made.
Historical data may also be revised for other reasons, e.g., for stock splits.