HOWTOs
- Get real OHLC price on a Heikin Ashi chart
- Plot arrows on the chart
- Plot a dynamic horizontal line
- Plot vertical line on condition
- Access previous value
- Get a 5-day high
- Count bars in a dataset
- enumerate bars in a day
- Find the highest and lowest values for the entire dataset
- Query the last non-
navalue
Get real OHLC price on a Heikin Ashi chart
Suppose, we have a Heikin Ashi chart (or Renko, Kagi, PriceBreak etc) and we’ve added a pine script on it:
//@version=2
study("Visible OHLC", overlay=true)
c = close
plot(c)
You may see that variable c is a Heikin Ashi close price which is not
the same as real OHLC price. Because close built-in variable is always
a value that corresponds to a visible bar (or candle) on the chart.
So, how do we get the real OHLC prices in Pine Script code, if current
chart type is non-standard? We should use security function in
combination with tickerid function. Here is an example:
//@version=2
study("Real OHLC", overlay=true)
t = tickerid(syminfo.prefix, ticker)
realC = security(t, period, close)
plot(realC)
In a similar way we may get other OHLC prices: open, high and low.
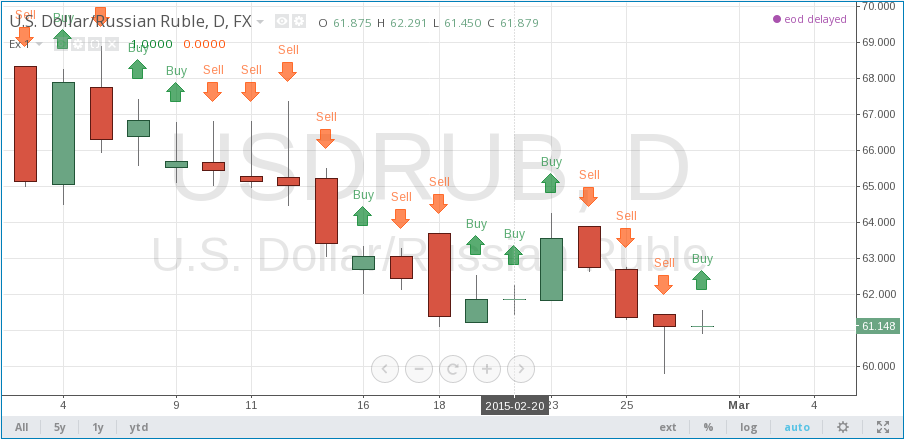
Plot arrows on the chart
You may use plotshape with style shape.arrowup and
shape.arrowdown:
study('Ex 1', overlay=true)
data = close >= open
plotshape(data, color=lime, style=shape.arrowup, text="Buy")
plotshape(not data, color=red, style=shape.arrowdown, text="Sell")
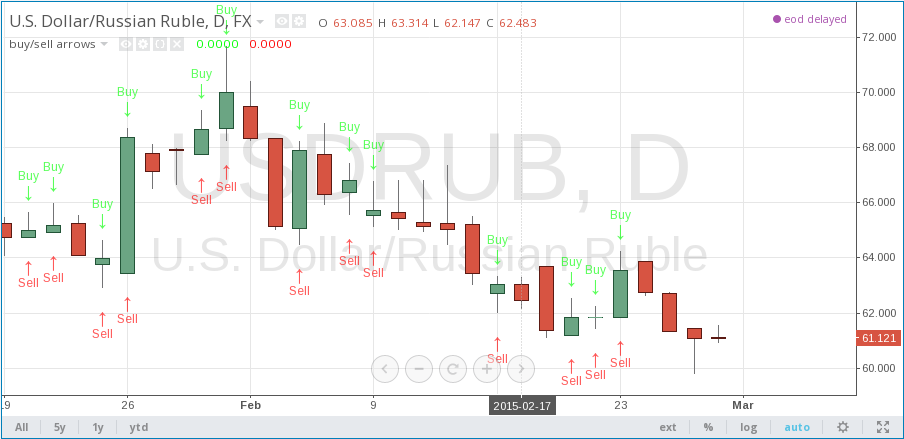
You may use plotchar function with any unicode character:
study('buy/sell arrows', overlay=true)
data = close >= open
plotchar(data, char='↓', color=lime, text="Buy")
plotchar(data, char='↑', location=location.belowbar, color=red, text="Sell")
Plot a dynamic horizontal line
There is function hline in pine. But it is now limited to only plot
constant value. Here is a Pine Script with workaround to plot changing
hline:
//@version=2
study("Horizontal line", overlay=true)
plot(close[10], trackprice=true, offset=-9999)
// trackprice=true plots horizontal line on close[10]
// offset=-9999 hides the plot
plot(close, color=#FFFFFFFF) // forces to show study
Plot vertical line on condition
//@version=2
study("Vertical line", overlay=true, scale=scale.none)
// scale.none means do not resize the chart to fit this plot
// if the bar being evaluated is the last baron the chart (the most recent bar), then cond is true
cond = barstate.islast
// when cond is true, plot a histogram with a line with height value of 100,000,000,000,000,000,000.00
// (10 to the power of 20)
// when cond is false, plot no numeric value (nothing is plotted)
// use the style of histogram, a vertical bar
plot(cond ? 10e20 : na, style = histogram)
Access previous value
//@version=3
//...
s = 0.0
s := nz(s[1]) // Accessing previous values
if (condition)
    s := s + 1
Get a 5-day high
Lookback 5 days from the current bar, find the highest bar, plot a star character at that price level above the current bar
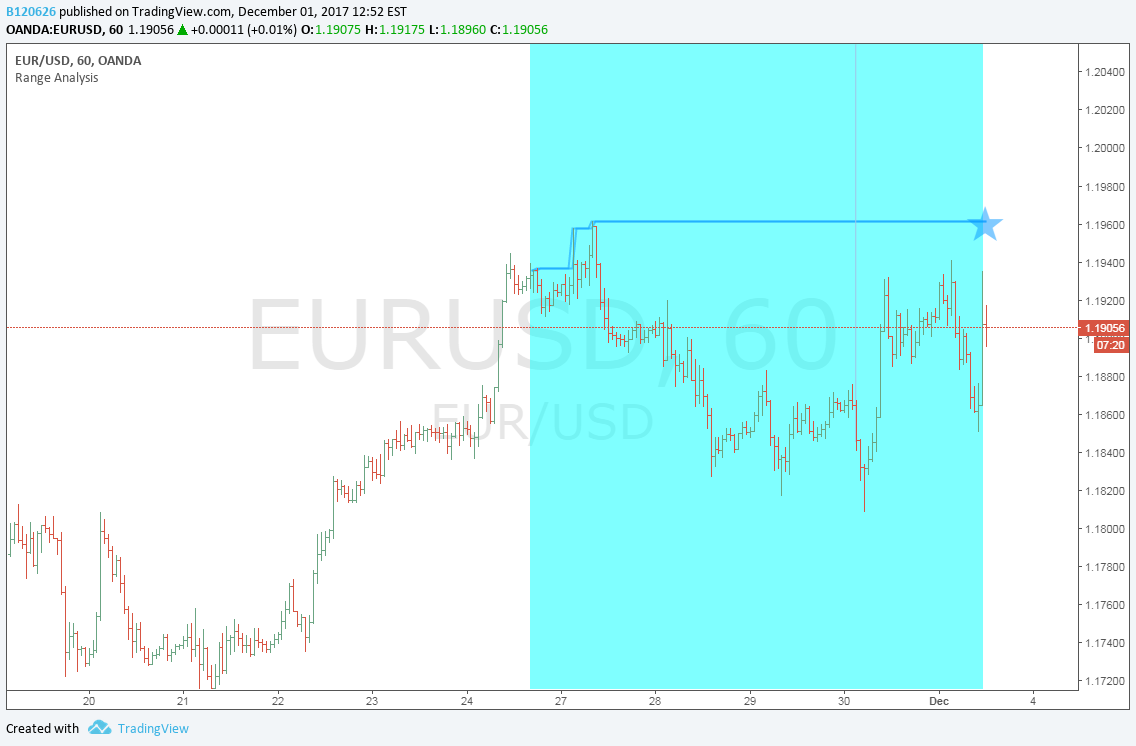
//@version=3
study("Range Analysis", overlay=true)

// find which bar is 5 days away from the current time
milliseconds_in_5days = 1000 * 60 * 60 * 24 * 5 // millisecs * secs * min * hours * days
// plot(milliseconds_in_5days, title="ms in 5d", style=circles) //debug
// subtract timestamp of the bar being examined from the current time
// if value is less than 5 days ago, set variable "leftborder" as true
// this is set true at the bar being examined as the left border of the 5 day lookback window range
leftborder = (timenow - time) < milliseconds_in_5days  // true or na when false
// plot(leftborder ? 1 : na, title="bar within leftborder")  //debug
// plot(time, title="bartime") //debug
// plot(timenow - time, title="timenow minus bartime")  //debug

// treat the last bar (most recent bar) as the right edge of the lookback window range
rightborder = barstate.islast

// initialize variable "max" as na
max = na

// if bar being examined is not within the lookback window range (i.e. leftborder = false)
// change the variable "max" to be na
// else, test if value of "max" stored in the previous bar is na
// (bcuz first bar being examined in the lookback window will not have a previous value ),
// if it is na, use the high of the current bar,
// else, use the value of "max" stored in the previous bar
max := not leftborder ? na : na(max[1]) ? high : max[1]
// plot(max ? max : na, title="max b4 compare")  // debug

// compare high of current bar being examined with previous bar's high
// if curr bar high is higher than the max bar high in the lookback window range
if high > max // we have a new high
    max := high // change variable "max" to use current bar's high value
// else keep the previous value of max as the high bar within this lookback window range
// plot(max ? max : na, title="max after compare")  //debug

// if examining the last bar (newest bar, rightborder is true)
// set variable "val" to the previous value of series variable "max"
// else set to na so nothing is plotted
val = rightborder ? max[1] : na

// if val is true (a number, not na)
// plot character
// since no character is specified, a "star" will be plotted
// location.absolute uses the value of val as the y axis value
// the x axis location will be the last bar (newest bar)
plotchar(val, size=size.normal, location=location.absolute)

// fill the background of the 5 day lookback window range with aqua color
bgcolor(leftborder and not rightborder ? aqua : na, transp=70)
Count bars in a dataset
Get a count of all the bars in the loaded dataset. Might be useful for calculating flexible lookback periods based on number of bars.
//@version=3
study("Bar Count", overlay=true, scale=scale.none)
plot(n + 1, style=histogram)
enumerate bars in a day
//@version=3
study("My Script", overlay=true, scale=scale.none)

is_new_day() =>
    d=dayofweek
    na(d[1]) or d != d[1]

plot(barssince(is_new_day()), style=cross)
Find the highest and lowest values for the entire dataset
//@version=3
study("My Script")

biggest(series) =>
    max = 0.0
    max := nz(max[1], series)
    if series > max
        max := series
    max

smallest(series) =>
    min = 0.0
    min := nz(min[1], series)
    if series < min
        min := series
    min

plot(biggest(close), color=green)
plot(smallest(close), color=red)
Query the last non-na value
You can use the script below to avoid gaps in a series:
//@version=3
study("My Script")
series = close >= open ? close : na
vw = valuewhen(not na(series), series, 0)
plot(series, style=linebr, color=red) // series has na values
plot(vw) // all na values are replaced with the last non-empty value