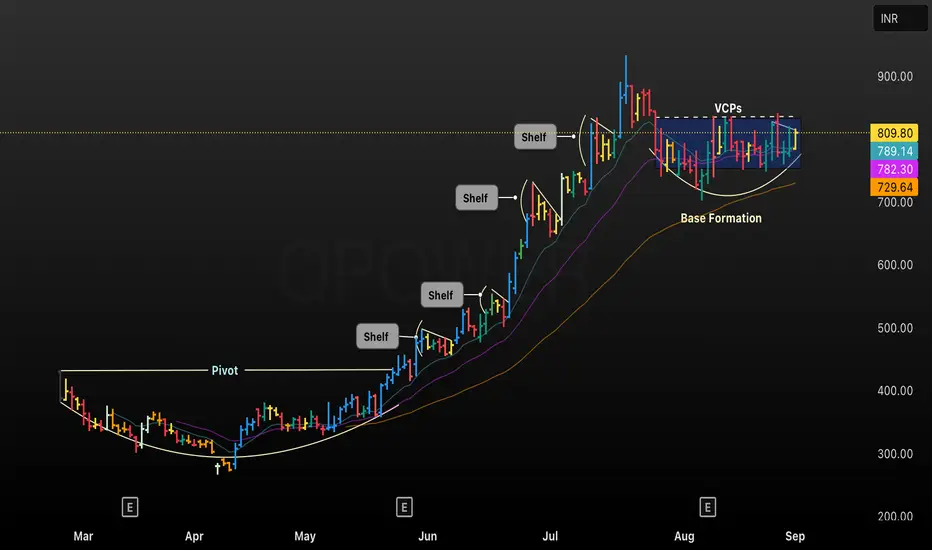
This TradingView chart of QPOWER showcases a classic growth stock progression from a Pivot breakout through multiple consolidation phases known as Shelves, indicated by horizontal pauses in price action above key moving averages. The recent price structure features a well-defined Base Formation followed by multiple VCPs (Volatility Contraction Patterns), signaling tightening price ranges and potential breakout readiness. Key moving averages are highlighted (789.14, 782.30, 729.64) to guide risk management for trend-following entries and exits.
• Technical patterns annotated: Pivot, Shelf, VCP, Base Formation
• Chart timeframe: Daily (D)
• Purpose: Used for trade decision-making and educational discussion on breakout setups and volatility contraction patterns
• Technical patterns annotated: Pivot, Shelf, VCP, Base Formation
• Chart timeframe: Daily (D)
• Purpose: Used for trade decision-making and educational discussion on breakout setups and volatility contraction patterns
Haftungsausschluss
Die Informationen und Veröffentlichungen sind nicht als Finanz-, Anlage-, Handels- oder andere Arten von Ratschlägen oder Empfehlungen gedacht, die von TradingView bereitgestellt oder gebilligt werden, und stellen diese nicht dar. Lesen Sie mehr in den Nutzungsbedingungen.
Haftungsausschluss
Die Informationen und Veröffentlichungen sind nicht als Finanz-, Anlage-, Handels- oder andere Arten von Ratschlägen oder Empfehlungen gedacht, die von TradingView bereitgestellt oder gebilligt werden, und stellen diese nicht dar. Lesen Sie mehr in den Nutzungsbedingungen.