Following its Q3 report with EPS of $12.25 (above expectations) and ~20% revenue growth,  GS shares held firm and began to recover.
Key levels:
Support: $760 – 765
Resistance / Target: $809 — previous profit-taking zone
MACD is showing signs of a bullish reversal
Price structure suggests a potential short-term upward zigzag pattern
A breakout above $780 could confirm momentum toward the $809 target.
Fundamentally, GS remains one of the strongest names in the banking sector, with M&A and investment banking activity gaining traction again.
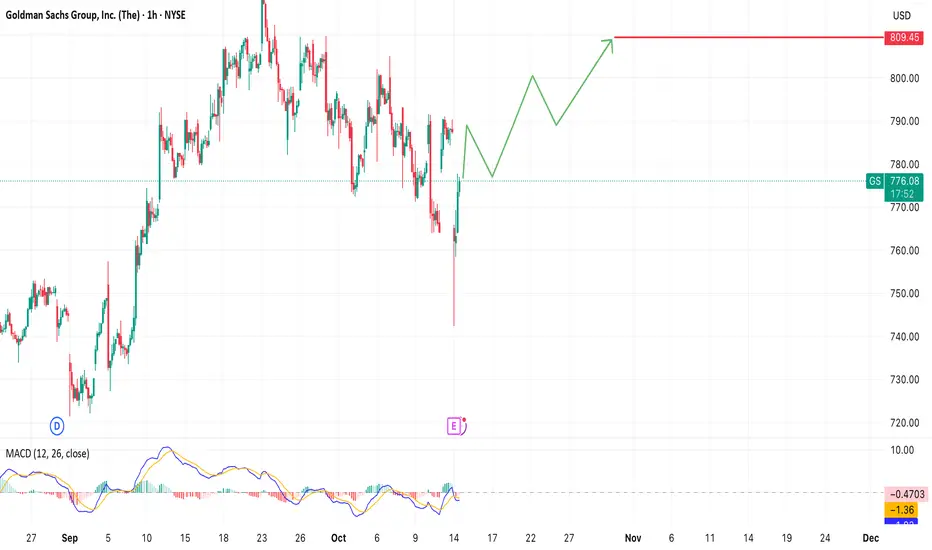
Haftungsausschluss
Die Informationen und Veröffentlichungen sind nicht als Finanz-, Anlage-, Handels- oder andere Arten von Ratschlägen oder Empfehlungen gedacht, die von TradingView bereitgestellt oder gebilligt werden, und stellen diese nicht dar. Lesen Sie mehr in den Nutzungsbedingungen.
Haftungsausschluss
Die Informationen und Veröffentlichungen sind nicht als Finanz-, Anlage-, Handels- oder andere Arten von Ratschlägen oder Empfehlungen gedacht, die von TradingView bereitgestellt oder gebilligt werden, und stellen diese nicht dar. Lesen Sie mehr in den Nutzungsbedingungen.