Parameters Data
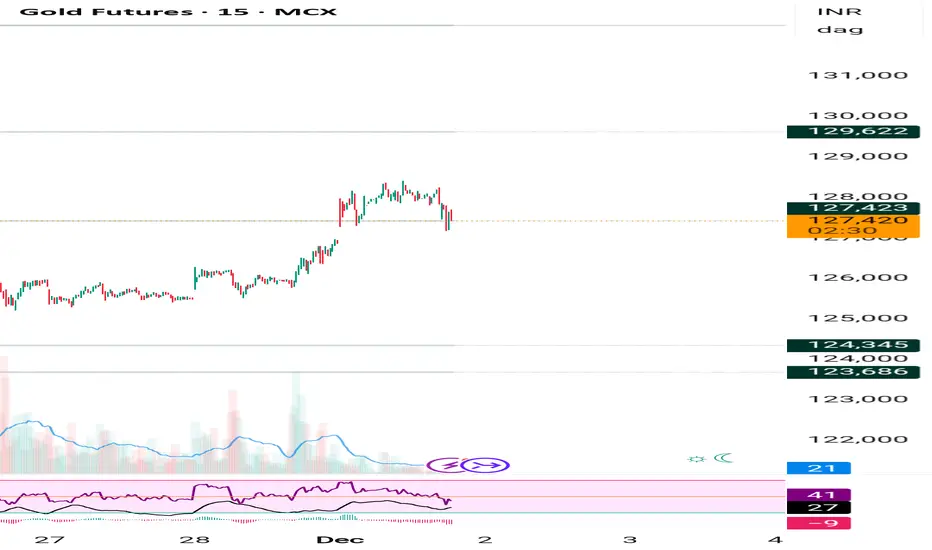
Asset Name: Price Gold MCX (Dec 2025 Fut): ₹1,28,660 🟩 (+1,717 Points) (+1.35%)
Price Movement Upmove will continue to [R1: 129500], [R2: 130500] if break [R2] then breakout Until [128000] not break if break then [S1: 127200] , [S2: 126500] possible.
R:R 1 : 1.5 [ breakout above 129000 & Breakdown below 128000]
Current Trade 🟩 BUY (T1: 129500, T2: 130200, SL: 127900)
Probability 🟩 75% (Strong continuation of trend confirmed by global factors)
Confidence 🟩 22/30 (73.33%)
Max Pain 🟨 ₹1,27,500 (Current data indicates call writer stress)
DEMA Levels 20-DEMA, 50-DEMA, 100-DEMA, 200-DEMA: All pointing upwards and below the price. 🟩
Supports S1: 1,28,000 🟩 (Immediate breakout retest level), S2: 1,27,200 🟩 (Key Pivot), S3: 1,26,500 🟩
Resistances R1: 1,29,500 🟥 (Immediate target), R2: 1,30,500 🟥 (Psychological Level), R3: 1,31,200 🟥
ADX/RSI/DMI RSI (14) near 66 🟩 (Strong momentum, not yet extremely overbought), ADX (14) near 31 🟩 (Trend is strong)
Market Depth (L3) Aggressive buying interest at lower levels (bids>offers). 🟩
Volatility (IV/RV) Volatility is rising with the price surge. 🟩
Source Ledger MCX, Comex, CME Feeds, Investing.com, Nirmal Bang 🟩
OI Long Buildup (OI and Price both rising). 🟩
PCR (OI) Near 1.05 🟨 (Slightly neutral/balanced, not showing extreme bearishness)
VWAP Price trading significantly above VWAP. 🟩
Turnover Volume is supporting the uptrend. 🟩
Harmonic Pattern N/A 🟨
IV/RV IV is firm. 🟩
Options Skew N/A 🟨
Vanna/Charm N/A 🟨
Block Trades Not explicitly tracked for this contract. 🟨
COT Positioning N/A 🟨
Cross-Asset Correlation Negative correlation with USD, Positive with Silver. 🟩
ETF Rotation Global Gold ETF inflows are positive. 🟩
Sentiment Index Greed (High bullish sentiment). 🟩
OFI Strong Positive Order Flow. 🟩
Delta Call Delta accumulation is high. 🟩
VWAP Bands Price breaking towards the upper band. 🟩
Rotation Metrics Commodity complex shows rotation strength. 🟩
Haftungsausschluss
Die Informationen und Veröffentlichungen sind nicht als Finanz-, Anlage-, Handels- oder andere Arten von Ratschlägen oder Empfehlungen gedacht, die von TradingView bereitgestellt oder gebilligt werden, und stellen diese nicht dar. Lesen Sie mehr in den Nutzungsbedingungen.
Haftungsausschluss
Die Informationen und Veröffentlichungen sind nicht als Finanz-, Anlage-, Handels- oder andere Arten von Ratschlägen oder Empfehlungen gedacht, die von TradingView bereitgestellt oder gebilligt werden, und stellen diese nicht dar. Lesen Sie mehr in den Nutzungsbedingungen.