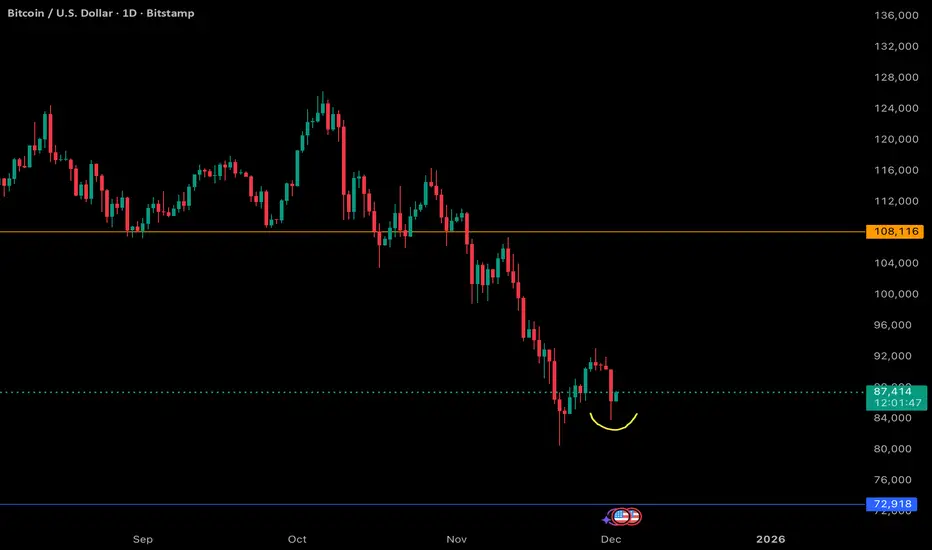
BTC’s latest reaction is quietly strong and more bullish than it may look at first glance. After the sharp drop, price immediately found demand and has now put in a clear higher low relative to the recent capitulation wick. That yellow-curved region on the chart highlights a key shift in behavior: sellers pushed hard, but buyers stepped in earlier than before, defending higher levels and preventing a retest of the prior lows.
This is the first meaningful sign of structure forming after weeks of one-sided downside. A higher low is often the earliest signal that the market is transitioning from liquidation-driven selling into accumulation. It shows that bidders are becoming more aggressive, absorbing supply before it can revisit deeper support.
On top of that, BTC is holding above the local support band that previously acted as resistance. Flipping that area into support and then defending it is a strong indication of emerging strength. The current reaction has less volatility, fewer long wicks, and more controlled candles, which typically points to absorption rather than panic.
While the trend hasn’t fully reversed yet, this kind of price behavior is how bottoms and mid-cycle resets form. BTC is starting to build a constructive base, and the market is showing the first bullish structural clue it has printed in a few days.
Onchain News is a Crypto research blog.
Tracking BTC, ETH, SOL, ZEC, DeFi projects, onchain flows, and more. 🌐 We also publish UFC / MMA news & opinions. 🥊
DMs open for new projects, follow us on X @OnchainNewsBlog. 📩
Tracking BTC, ETH, SOL, ZEC, DeFi projects, onchain flows, and more. 🌐 We also publish UFC / MMA news & opinions. 🥊
DMs open for new projects, follow us on X @OnchainNewsBlog. 📩
Verbundene Veröffentlichungen
Haftungsausschluss
Die Informationen und Veröffentlichungen sind nicht als Finanz-, Anlage-, Handels- oder andere Arten von Ratschlägen oder Empfehlungen gedacht, die von TradingView bereitgestellt oder gebilligt werden, und stellen diese nicht dar. Lesen Sie mehr in den Nutzungsbedingungen.