Based on the charts and the market's performance on Tuesday, October 14, the Bank Nifty experienced a sharp reversal from its highs and a breakdown from its short-term ascending channel. The momentum has shifted to a short-term corrective bias.
Detailed Market Structure Breakdown
4-Hour Chart (Macro Trend)
Structure: The Bank Nifty is still in a bullish uptrend, but the price has broken below the lower trendline of its steep short-term ascending channel. The last 4H candle is a strong bearish candle that confirms the Market Structure Shift (MSS) to the downside, signaling a likely deeper pullback.
Key Levels:
Major Supply (Resistance): 56,600 - 56,800. This area is the immediate overhead supply zone, aligning with the rejection high.
Major Demand (Support): 55,400 - 55,600. This area is the key FVG (Fair Value Gap) and the most significant horizontal support for the current uptrend.
Outlook: The trend has shifted to sideways-to-bearish. The market is expected to consolidate or correct towards the 55,400 - 55,600 zone.
1-Hour Chart (Intermediate View)
Structure: The 1H chart shows a clear breakdown from the steep ascending channel. The price is now trading within a newly formed descending channel, making lower highs and lower lows.
Key Levels:
Immediate Resistance: The upper trendline of the descending channel, near 56,300.
Immediate Support: 56,000 (The psychological level and the bottom of the current corrective channel).
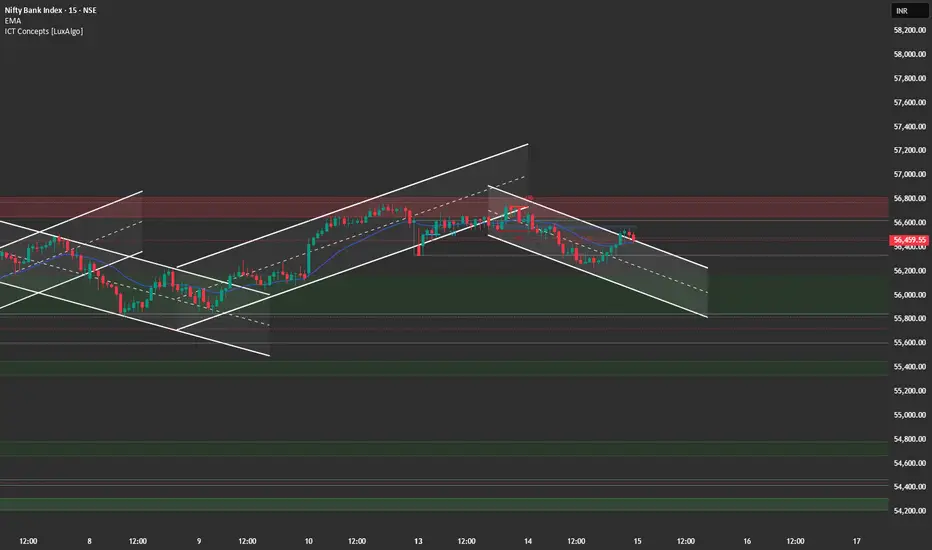
15-Minute Chart (Intraday View)
Structure: The 15M chart confirms the intraday bearish momentum. The price broke out of a small consolidation range to the downside and closed near its low, indicating strong bearish control.
Key Levels:
Intraday Supply: 56,300.
Intraday Demand: 56,000.
Outlook: Bearish. A "Sell on Rise" strategy is recommended near 56,300.
📈 Trade Plan (Wednesday, 15th October)
Market Outlook: The Bank Nifty is undergoing a sharp short-term correction. The primary strategy will be to sell into strength or on a breakdown of immediate support. Tech Mahindra and Persistent Systems Q2 results are due today, which may provide sector-specific volatility.
Bearish Scenario (Primary Plan)
Justification: The breakdown of the steep channel and the rejection from the highs favor a continuation of the correction.
Entry: Short entry on a successful retest and rejection of the 56,300 level (upper channel resistance). Alternatively, short a decisive break and 15-minute candle close below 56,000.
Stop Loss (SL): Place a stop loss above 56,600 (above the immediate swing high/supply zone).
Targets:
T1: 55,800 (Minor support/FVG).
T2: 55,400 (Major FVG support).
Bullish Scenario (Counter-Trend/Reversal Plan)
Justification: Only valid if Q2 results provide a strong positive surprise, leading to a break of the current channel.
Trigger: A sustained move and close above the major resistance at 56,600.
Entry: Long entry on a confirmed 15-minute close above 56,600.
Stop Loss (SL): Below 56,400.
Targets:
T1: 57,000 (Psychological target).
T2: 57,300 (Extension target).
Key Levels for Observation:
Immediate Decision Point: 56,000 - 56,300 zone.
Bearish Confirmation: A break and sustained move below 56,000.
Bullish Confirmation: A move back above 56,600.
Line in the Sand: 55,800. Below this level, the short-term bullish bias is severely challenged.
Detailed Market Structure Breakdown
4-Hour Chart (Macro Trend)
Structure: The Bank Nifty is still in a bullish uptrend, but the price has broken below the lower trendline of its steep short-term ascending channel. The last 4H candle is a strong bearish candle that confirms the Market Structure Shift (MSS) to the downside, signaling a likely deeper pullback.
Key Levels:
Major Supply (Resistance): 56,600 - 56,800. This area is the immediate overhead supply zone, aligning with the rejection high.
Major Demand (Support): 55,400 - 55,600. This area is the key FVG (Fair Value Gap) and the most significant horizontal support for the current uptrend.
Outlook: The trend has shifted to sideways-to-bearish. The market is expected to consolidate or correct towards the 55,400 - 55,600 zone.
1-Hour Chart (Intermediate View)
Structure: The 1H chart shows a clear breakdown from the steep ascending channel. The price is now trading within a newly formed descending channel, making lower highs and lower lows.
Key Levels:
Immediate Resistance: The upper trendline of the descending channel, near 56,300.
Immediate Support: 56,000 (The psychological level and the bottom of the current corrective channel).
15-Minute Chart (Intraday View)
Structure: The 15M chart confirms the intraday bearish momentum. The price broke out of a small consolidation range to the downside and closed near its low, indicating strong bearish control.
Key Levels:
Intraday Supply: 56,300.
Intraday Demand: 56,000.
Outlook: Bearish. A "Sell on Rise" strategy is recommended near 56,300.
📈 Trade Plan (Wednesday, 15th October)
Market Outlook: The Bank Nifty is undergoing a sharp short-term correction. The primary strategy will be to sell into strength or on a breakdown of immediate support. Tech Mahindra and Persistent Systems Q2 results are due today, which may provide sector-specific volatility.
Bearish Scenario (Primary Plan)
Justification: The breakdown of the steep channel and the rejection from the highs favor a continuation of the correction.
Entry: Short entry on a successful retest and rejection of the 56,300 level (upper channel resistance). Alternatively, short a decisive break and 15-minute candle close below 56,000.
Stop Loss (SL): Place a stop loss above 56,600 (above the immediate swing high/supply zone).
Targets:
T1: 55,800 (Minor support/FVG).
T2: 55,400 (Major FVG support).
Bullish Scenario (Counter-Trend/Reversal Plan)
Justification: Only valid if Q2 results provide a strong positive surprise, leading to a break of the current channel.
Trigger: A sustained move and close above the major resistance at 56,600.
Entry: Long entry on a confirmed 15-minute close above 56,600.
Stop Loss (SL): Below 56,400.
Targets:
T1: 57,000 (Psychological target).
T2: 57,300 (Extension target).
Key Levels for Observation:
Immediate Decision Point: 56,000 - 56,300 zone.
Bearish Confirmation: A break and sustained move below 56,000.
Bullish Confirmation: A move back above 56,600.
Line in the Sand: 55,800. Below this level, the short-term bullish bias is severely challenged.
Haftungsausschluss
Die Informationen und Veröffentlichungen sind nicht als Finanz-, Anlage-, Handels- oder andere Arten von Ratschlägen oder Empfehlungen gedacht, die von TradingView bereitgestellt oder gebilligt werden, und stellen diese nicht dar. Lesen Sie mehr in den Nutzungsbedingungen.
Haftungsausschluss
Die Informationen und Veröffentlichungen sind nicht als Finanz-, Anlage-, Handels- oder andere Arten von Ratschlägen oder Empfehlungen gedacht, die von TradingView bereitgestellt oder gebilligt werden, und stellen diese nicht dar. Lesen Sie mehr in den Nutzungsbedingungen.