📊 BANK NIFTY TRADING PLAN — 05 NOV 2025
(Timeframe Reference: 15-min Chart)
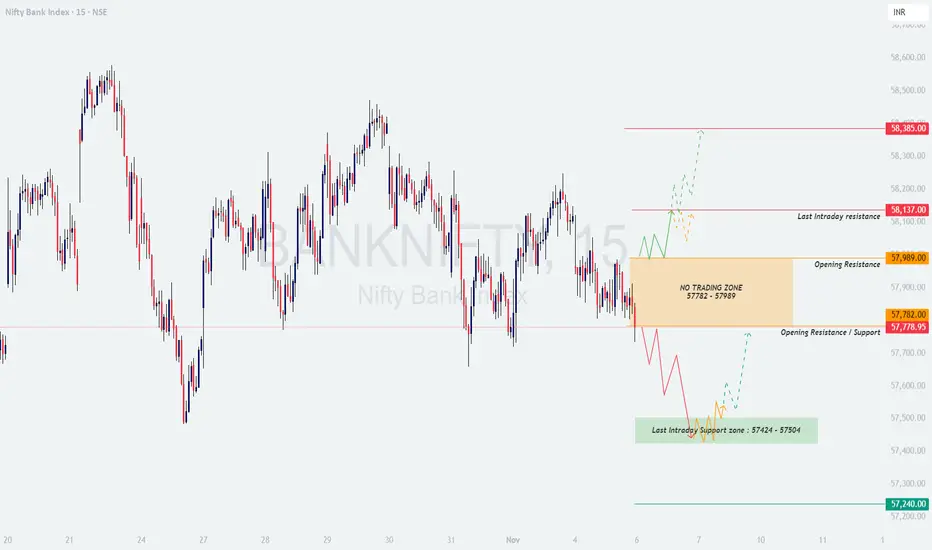
Chart Summary:
Bank Nifty is currently trading near the 57,780 zone, which lies just below the key Opening Resistance area (57,782 – 57,989). A clear No Trading Zone has been identified between these levels, suggesting indecision at the open. A strong directional move is expected once the index breaks out of this band.
🟢 Scenario 1: GAP-UP Opening (200+ points)
If Bank Nifty opens above 58,000, it will likely test the immediate resistance near 58,137. A sustained move above this could invite momentum buying towards 58,385 — the next intraday resistance.
🧠 Educational Note: Gap-up openings often trigger emotional entries. Always let the first 15–30 minutes settle before committing to a direction. Breakout confirmation through strong volume is essential to avoid traps.
🟧 Scenario 2: FLAT Opening (Within 57,782 – 57,989)
This range represents a No Trading Zone. Price is likely to remain volatile and whipsaw both sides before confirming direction. Patience is key here.
💡 Educational Tip: Flat openings are ideal for breakout traders. Wait for clear directional volume confirmation before entering. Most false moves happen when traders anticipate instead of reacting.
🔴 Scenario 3: GAP-DOWN Opening (200+ points)
If the index opens below 57,600, weakness may extend towards the Last Intraday Support zone (57,424 – 57,504). This zone is critical for bulls to defend.
📘 Educational Insight: Gap-downs often lead to panic selling in the first 10–15 minutes. Always wait for the price to form a base before anticipating reversals. Intraday traders should track if volume drops near key support levels — it often hints at exhaustion of selling.
💼 RISK MANAGEMENT TIPS FOR OPTIONS TRADERS:
📈 SUMMARY:
📚 CONCLUSION:
The structure suggests Bank Nifty is at a crucial decision point. Bulls must reclaim 58,000+ to re-establish control, while bears will try to push it below 57,780. Staying patient during the opening volatility and respecting breakout levels can make the difference between profit and emotional trades.
⚠️ DISCLAIMER:
I am not a SEBI-registered analyst. The views expressed here are for educational purposes only. Please conduct your own research or consult a financial advisor before making trading decisions.
(Timeframe Reference: 15-min Chart)
Chart Summary:
Bank Nifty is currently trading near the 57,780 zone, which lies just below the key Opening Resistance area (57,782 – 57,989). A clear No Trading Zone has been identified between these levels, suggesting indecision at the open. A strong directional move is expected once the index breaks out of this band.
🟢 Scenario 1: GAP-UP Opening (200+ points)
If Bank Nifty opens above 58,000, it will likely test the immediate resistance near 58,137. A sustained move above this could invite momentum buying towards 58,385 — the next intraday resistance.
- []If price sustains above 58,137 with strong candle close, traders may consider long positions with a target towards 58,385.
[]Stop-loss can be maintained just below 57,980, as falling below this zone may trigger a pullback back into the range. - If price fails to sustain above 58,137 and shows rejection candles, short traders can look for a retracement back toward 57,989 – 57,780 zone.
🧠 Educational Note: Gap-up openings often trigger emotional entries. Always let the first 15–30 minutes settle before committing to a direction. Breakout confirmation through strong volume is essential to avoid traps.
🟧 Scenario 2: FLAT Opening (Within 57,782 – 57,989)
This range represents a No Trading Zone. Price is likely to remain volatile and whipsaw both sides before confirming direction. Patience is key here.
- []Avoid initiating fresh positions within the zone (57,782 – 57,989).
[]If price breaks above 57,989 decisively, expect a potential rise toward 58,137, followed by 58,385. - If price breaks below 57,782, it may drag the index towards the lower intraday support near 57,504 – 57,424.
💡 Educational Tip: Flat openings are ideal for breakout traders. Wait for clear directional volume confirmation before entering. Most false moves happen when traders anticipate instead of reacting.
🔴 Scenario 3: GAP-DOWN Opening (200+ points)
If the index opens below 57,600, weakness may extend towards the Last Intraday Support zone (57,424 – 57,504). This zone is critical for bulls to defend.
- []If a reversal candle forms near 57,424 – 57,504, buyers may attempt a short-covering move back toward 57,780.
[]However, a sustained move below 57,400 can extend the fall toward 57,240, which acts as the final intraday support. - Traders should avoid shorting deep gap-downs immediately — instead, wait for a pullback to the nearest resistance (57,700–57,780) for better risk-reward.
📘 Educational Insight: Gap-downs often lead to panic selling in the first 10–15 minutes. Always wait for the price to form a base before anticipating reversals. Intraday traders should track if volume drops near key support levels — it often hints at exhaustion of selling.
💼 RISK MANAGEMENT TIPS FOR OPTIONS TRADERS:
- []Avoid buying options during the first 15 minutes of volatile openings — IV (Implied Volatility) spikes can inflate premium costs.
[]Always define your risk before entering. Limit your exposure to 1–2% of total capital per trade.
[]If trading intraday options, trail your stop-loss after a 30–40 point favorable move in Bank Nifty.
[]Use ITM options for directional confidence and avoid far OTM strikes on non-trending days. - Stay disciplined — remember, missing a trade is better than being trapped in a false breakout.
📈 SUMMARY:
- []🟧 No Trading Zone: 57,782 – 57,989
[]🟥 Resistance Zones: 58,137 / 58,385
[]🟩 Support Zones: 57,504 – 57,424 / 57,240
[]⚖️ Bias: Neutral-to-Bullish above 57,989 | Weakness below 57,782
📚 CONCLUSION:
The structure suggests Bank Nifty is at a crucial decision point. Bulls must reclaim 58,000+ to re-establish control, while bears will try to push it below 57,780. Staying patient during the opening volatility and respecting breakout levels can make the difference between profit and emotional trades.
⚠️ DISCLAIMER:
I am not a SEBI-registered analyst. The views expressed here are for educational purposes only. Please conduct your own research or consult a financial advisor before making trading decisions.
Haftungsausschluss
Die Informationen und Veröffentlichungen sind nicht als Finanz-, Anlage-, Handels- oder andere Arten von Ratschlägen oder Empfehlungen gedacht, die von TradingView bereitgestellt oder gebilligt werden, und stellen diese nicht dar. Lesen Sie mehr in den Nutzungsbedingungen.
Haftungsausschluss
Die Informationen und Veröffentlichungen sind nicht als Finanz-, Anlage-, Handels- oder andere Arten von Ratschlägen oder Empfehlungen gedacht, die von TradingView bereitgestellt oder gebilligt werden, und stellen diese nicht dar. Lesen Sie mehr in den Nutzungsbedingungen.