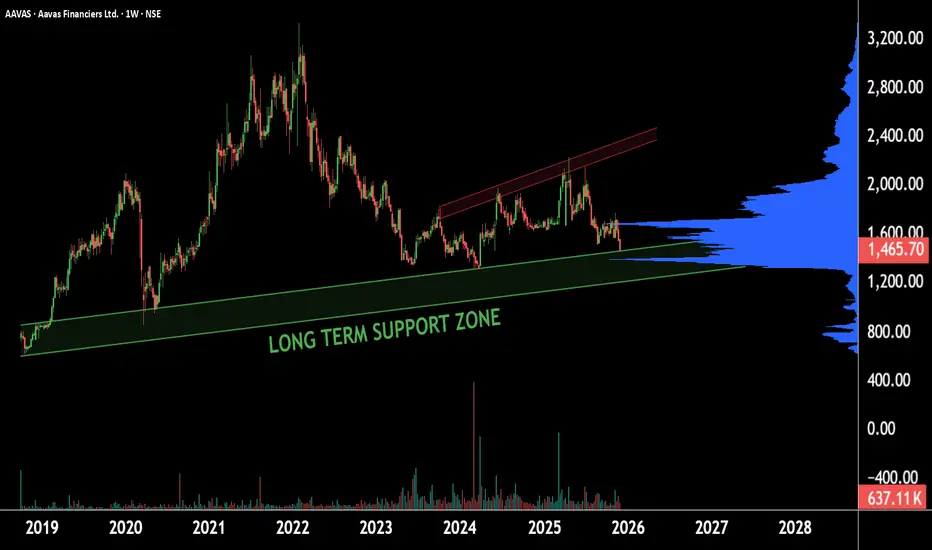
This is the weekly timeframe chart of AAVAS.
The stock is currently trending near its long-term support zone of ₹1400–₹1200.
The volume indicator also suggests significant accumulation around the ₹1350 range.
This zone acts as a major demand area, and the stock is likely to attempt a reversal from this region.
Thank you.
The stock is currently trending near its long-term support zone of ₹1400–₹1200.
The volume indicator also suggests significant accumulation around the ₹1350 range.
This zone acts as a major demand area, and the stock is likely to attempt a reversal from this region.
Thank you.
@RahulSaraoge
Connect us at t.me/stridesadvisory
Connect us at t.me/stridesadvisory
Haftungsausschluss
Die Informationen und Veröffentlichungen sind nicht als Finanz-, Anlage-, Handels- oder andere Arten von Ratschlägen oder Empfehlungen gedacht, die von TradingView bereitgestellt oder gebilligt werden, und stellen diese nicht dar. Lesen Sie mehr in den Nutzungsbedingungen.